10 Best Revenue Reporting Software in 2026: Dashboards, Custom Reports, Attribution Views, and Executive Summaries
Written by
Ishan Chhabra
Last Updated :
August 1, 2026
Skim in :
13
mins
In this article
Revenue teams love Oliv
Here’s why:
All your deal data unified (from 30+ tools and tabs).
Insights are delivered to you directly, no digging.
AI agents automate tasks for you.
Thank you! Your submission has been received!
Oops! Something went wrong while submitting the form.
Meet Oliv’s AI Agents
Hi! I’m, Deal Driver
I track deals, flag risks, send weekly pipeline updates and give sales managers full visibility into deal progress
Hi! I’m, CRM Manager
I maintain CRM hygiene by updating core, custom and qualification fields all without your team lifting a finger
Hi! I’m, Forecaster
I build accurate forecasts based on real deal movement and tell you which deals to pull in to hit your number
Hi! I’m, Coach
I believe performance fuels revenue. I spot skill gaps, score calls and build coaching plans to help every rep level up
Hi! I’m, Prospector
I dig into target accounts to surface the right contacts, tailor and time outreach so you always strike when it counts
Hi! I’m, Pipeline tracker
I call reps to get deal updates, and deliver a real-time, CRM-synced roll-up view of deal progress
Hi! I’m, Analyst
I answer complex pipeline questions, uncover deal patterns, and build reports that guide strategic decisions
TL;DR
Revenue reporting software in 2026 splits into tools you read and tools that act. Oliv AI leads for agentic reporting, Clari and Terret for forecast dashboards, Anaplan for finance modeling.
Four distinct artifacts get confused as one: dashboards monitor, custom reports investigate, attribution views assign credit, and executive summaries narrate. Most platforms are strong on one and weak on three.
Across verified G2 reviews from the last 24 months, two gaps repeat most: missing custom reporting and weak CRM writeback, named by paying Clari and Gong users alike.
Managers lose one to two hours per rep every Thursday and Friday reconstructing pipeline movement, so a manager with eight reps burns 8 to 16 hours weekly assembling a number.
Pricing splits three ways: per-seat at $19 to $500 per user monthly, per-action credits near $0.10 each, and flat per-organisation deals suited to many occasional question-askers.
Pressure-test vendors live with five tests: metric lineage, a custom report built on the call, CRM writeback into your sandbox, named connectors, and a human verifier for AI summaries.
Q1. What are the 10 best revenue reporting software tools for revenue teams in 2026? [toc=1. Best Tools Compared]
The best revenue reporting software in 2026 splits into tools you read and tools that act. Oliv AI leads for agentic reporting, where an Analyst agent answers plain-English revenue questions and a one-page brief lands in your inbox Monday. Clari and Terret lead forecast dashboards, Anaplan for finance modeling, Gong for conversation data, Salesforce for native CRM reporting.
📊 The Thursday problem nobody puts on a slide
Every Thursday and Friday, managers sit with reps for one to two hours each. They reconstruct what moved, what slipped, and what to commit. Then they hand-build the report they present Monday.
That is not reporting. That is manual data archaeology with a chart on top. I have watched RevOps leads spend more time assembling the forecast than acting on it.
🧩 Read-versus-act: the only split that matters now
Most tools on this list are excellent at the read layer. They collect data, calculate metrics, and render dashboards. Then they stop and hand the work back to you.
The act layer is different. An agent reads the same data, writes the summary, updates the CRM field, and flags the deal without being asked. Oliv AI operates in that act layer, with agents like Analyst, Deal Driver, and CRM Manager running across the revenue orchestration workflow.
The three-layer cake I use to evaluate any reporting tool:
Layer 1, baseline data collection. Recording, transcription, and activity capture. This should be close to free in 2026.
Layer 2, intelligence. Language models tracking qualification fields like MEDDIC and MEDDPICC or BANT against real conversations.
Layer 3, agent. Proactive one-pagers pushed to leadership, plus writeback to the system of record.
Most platforms here stop cleanly at layer two. That is the whole story of this category.
The 10 best revenue reporting software tools in 2026
Oliv AI, best for agentic reporting and automated executive summaries
Anaplan, best for finance-grade revenue modeling and scenario planning
Aviso, best for AI forecast scoring in enterprise sales orgs
Clari, best for pipeline inspection and forecast roll-ups
Forecastio, best for HubSpot-native sales performance reporting
Gong, best for conversation data and Revenue Analytics dashboards
InsightSquared, best for prebuilt sales analytics report libraries
People.ai, best for activity capture and account-relationship data
Revenue Grid, best for guided-selling signals and Salesforce sync
Salesforce, best for native CRM reports when you already own the license
Salesloft, best for engagement and cadence analytics
Terret (formerly BoostUp), best for configurable revenue-command dashboards
Master comparison table
Revenue Reporting Software Compared Across Four Artifacts (2026)
Tool
Dashboards
Custom reports
Attribution views
Executive summaries
CRM writeback
Pricing signal
Rating
Oliv AI
✅ Agent-generated
✅ Spreadsheet-like analysis
✅ Deal-to-source context
✅ Automated one-pagers
✅ Auto-updates after every call
From $19/user/month
⭐⭐⭐⭐⭐
Anaplan
✅ Highly configurable
✅ Model-driven
⚠️ Planning-led, not funnel-led
⚠️ Manual build
❌ Not a CRM sync tool
Enterprise licensing, cited as expensive
⭐⭐⭐
Aviso
✅ Forecast views
⚠️ Exports lose filters
⚠️ Limited
⚠️ Manual
⚠️ SFDC sync issues reported
Enterprise, quote-based
⭐⭐
Clari
✅ Strong out-of-box
❌ "No custom reporting"
⚠️ Limited
⚠️ Manual
❌ "CRM writeback is not good"
Enterprise, quote-based
⭐⭐⭐
Forecastio
✅ HubSpot-native
✅ Sales performance reports
⚠️ Pipeline-source level
⚠️ Partial
✅ HubSpot-native
SMB-friendly tiers
⭐⭐⭐
Gong
✅ Revenue Analytics
✅ Data Studio metrics
⚠️ Conversation-weighted
✅ AI briefs
⚠️ Export limits reported
Enterprise, seat pricing visible in admin
⭐⭐⭐⭐
InsightSquared
✅ Prebuilt library
✅ Report builder
⚠️ Limited
⚠️ Manual
⚠️ Sync-dependent
Mid-market tiers
⭐⭐⭐
People.ai
✅ Activity dashboards
✅ Account reports
✅ Contact-to-opportunity mapping
⚠️ Partial
✅ Activity writeback
Enterprise, quote-based
⭐⭐⭐
Revenue Grid
✅ Signal dashboards
✅ Configurable
⚠️ Limited
⚠️ Partial
✅ Salesforce sync
Mid-market tiers
⭐⭐⭐
Salesforce
✅ Native reports
✅ Report builder
⚠️ Needs add-ons
❌ Manual
✅ Native
Per-seat, plus agent action credits
⭐⭐⭐
Salesloft
✅ Cadence analytics
⚠️ Faulty metrics reported
❌ Engagement-only
❌ Manual
⚠️ Connectivity issues reported
Per-seat tiers
⭐⭐
Terret (BoostUp)
✅ Command-center views
✅ Configurable
⚠️ Partial
⚠️ Partial
✅ CRM sync
Enterprise, quote-based
⭐⭐⭐
Ratings follow the weighted rubric in the next section. They are not popularity scores.
1.1 Oliv AI [toc=1.1 Oliv AI]
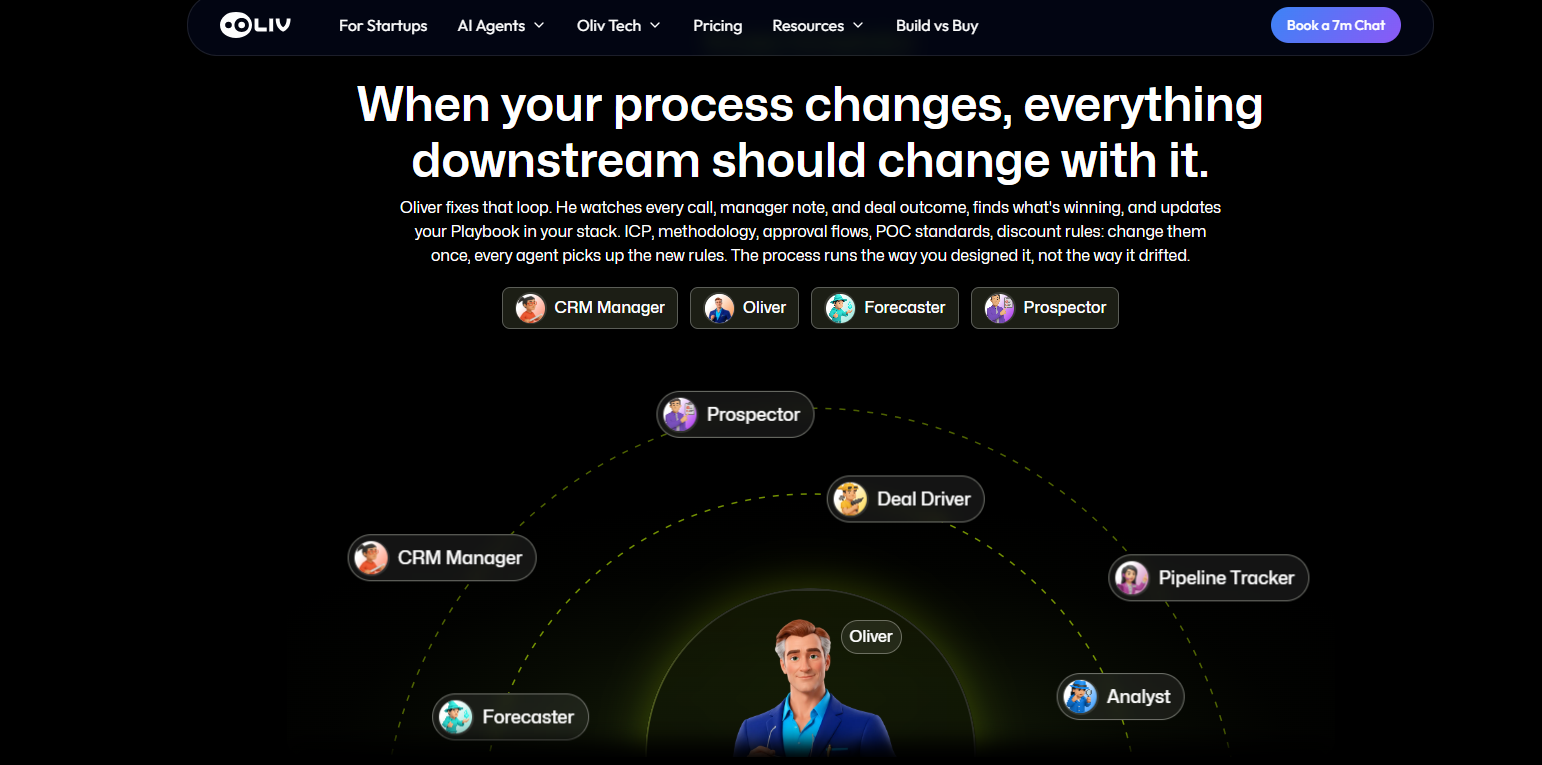
Oliv's orchestration diagram shows Oliver updating playbooks and syncing agents like Forecaster, Pipeline Tracker, and Analyst, keeping process changes reflected across every downstream report and revenue dashboard.
Oliv AI is an AI-native revenue intelligence platform where reporting is produced by agents rather than assembled by people. Founded in 2023 in San Francisco and backed by a $5M Foundation Capital seed, it now serves 100+ revenue teams.
⚙️ What it actually does
The reporting stack runs on named agents. The Analyst agent answers ad-hoc revenue questions on demand. The Deal Driver agent watches every open deal and flags risk. The CRM Manager agent writes fields back after each call.
Underneath sits the Context Graph, an intelligence layer that combines CRM object association with 100+ revenue-specific language models and a Process Graph encoding how your company sells.
🔑 Key features for reporting
Automated executive summaries. One-page briefs delivered without a manual roll-up, which is the Monday artifact managers currently hand-build.
Spreadsheet-like analysis. RevOps teams can query and slice revenue data directly, instead of writing custom code against a reporting API.
Custom methodology fields. Reviewers report filling out custom frameworks like MEDIC-BAND automatically from call content.
Forecast agent. Prepares weekly and monthly forecasts rather than waiting for a human to compile them, which is the core of any AI sales forecasting software evaluation.
CRM writeback. Automatic post-call updates to Salesforce, HubSpot, and Zoho, across 70+ integrations.
💰 Pricing and implementation
Pricing starts at $19 per user per month for the notetaker entry tier, with agents added one at a time rather than bought as a suite on day one. That matters if your budget is already committed elsewhere.
Setup is fast in practice. One reviewer describes a five-to-fifteen-minute configuration. Another describes forward-deployed engineers finishing a full rollout in under a week.
✅ Pros and ❌ cons
✅ Reporting is generated and acted on, not just displayed
✅ Automatic CRM updates after every call, verified in multiple G2 reviews
✅ Entry pricing at $19/user/month with modular agent expansion
✅ Fast deployment, reported in days rather than quarters
❌ Dashboard and analytics customization is the most common request in Oliv's own reviews
❌ Reviewers report occasional slowness and a basic mobile app
❌ Not the right fit for pure call-recording use cases or teams unwilling to let agents act
🗣️ Real user feedback
"The Analyst agent allows me to understand everything I need with just one click, eliminating the long wait time I used to have with RevOps to get answers. The Driver agent watches all my deals and flags any that are at risk, so I don't have to spend hours listening to recordings in tools like Gong and Clari." Verified User, 17 Jun 2026Oliv AI G2 Verified Review
"I'd love to see few more options to customize dashboards and reports for different teams." Verified User, 26 Jun 2026Oliv AI G2 Verified Review
"The main downside is that the analytics could be more customizable. It's a minor issue, but having more flexibility in how I view and configure analytics would make it even better." Verified User, 8 Jul 2026Oliv AI G2 Verified Review
I want to be honest about that second and third quote. The dashboard-customization gap is real, and it is the predictable trade-off of an agent-first design. Oliv AI's bet is that a delivered one-pager beats a configurable chart nobody opens, though I might be weighting that preference more heavily than a BI-minded RevOps lead would.
🎯 Best use case
A 25-to-200-rep mid-market B2B team where managers still hand-build the Monday forecast, and where CRM hygiene is the root cause of bad reporting.
Oliv AI's reporting layer is an agent, not a dashboard: the Analyst agent answers ad-hoc revenue questions and the forecast agent ships weekly and monthly roll-ups without a manual scrub.
1.2 Anaplan [toc=1.2 Anaplan]
Anaplan's GTM planning dashboard models customer tiers, bookings targets, and renewal assumptions, connecting sales and finance data into unified revenue reporting for defensible, AI-driven forecasts and executive summaries.
Anaplan is a connected-planning platform used for finance-grade revenue modeling, scenario analysis, and variance reporting. It is the right pick when your reporting question is "what happens to revenue if we change three assumptions," not "which deal is at risk."
🧮 What it actually does
Anaplan builds multidimensional models where a single variable change updates the entire dataset and every dashboard built on it. Reviewers use it for forecasting, sales projections, resource planning, and aging reports.
Its scope has widened beyond finance into sales, supply chain, retail, and workforce planning. Financial Close and Consolidation solutions were added recently, plus prebuilt applications that reviewers say cut implementation by two to three weeks.
🔑 Key features for reporting
Variable-driven dashboards. Update one risk factor and the full dataset and visual layer recalculate together.
Dynamic scenario and variance analysis. Run in-app, without exporting to a separate BI tool.
Low-code model building. Business users can maintain models after the initial implementation.
Prebuilt planning applications. Shorten deployment for standard finance use cases.
📅 Anaplan reporting capability, then and now
Anaplan Product Update Timeline for Revenue Reporting
Period
What was in the product
Through 2025
Connected planning across finance, sales, supply chain, retail, and workforce, with dashboard reporting, scenario and variance analysis, and low-code model building maintained by business users, per verified G2 reviewer detail
Late 2025 into 2026
Financial Close and Consolidation solutions added, prebuilt applications reducing implementation by two to three weeks, and improved third-party integration via ADO for faster multi-source data pulls, per verified G2 reviewer detail
Expected next
Reviewers point to continued expansion of AI and generative features, currently described as costly with narrow use cases, alongside pressure to improve large-dataset performance and Excel-based ad-hoc analysis, per verified G2 reviewer detail
💰 Pricing and implementation
Anaplan uses enterprise licensing without public list pricing. Reviewers consistently flag the cost, describing an expensive licensing model where scalability "comes at a significant expense".
Implementation is a project, not a setup. Prebuilt apps help, but expect a modeling exercise with a partner or an internal Anaplan-certified builder.
✅ Pros and ❌ cons
✅ Best-in-class scenario modeling and variance analysis for revenue planning
✅ One variable change cascades through the full dataset and dashboards
✅ Low-code maintenance after go-live, plus responsive support
❌ Limited API makes real-time syncing to warehouses like Snowflake difficult, so reviewers schedule batch syncs instead
❌ Performance degrades on large datasets, and licensing is repeatedly called expensive
❌ Ad-hoc Excel analysis is weaker than rival EPM tools, forcing work back into the application
❌ Role-based access described as inflexible, pushing teams to over-assign admin roles
🗣️ Real user feedback
"Anaplan does not integrate seamlessly with third party platforms given its limited API. Therefore, it is difficult to sync data between Anaplan and our Snowflake data warehouse in real-time." Verified User, 3 Jun 2025Anaplan G2 Verified Review
"I think role-based access could use an improvement. It wasn't very flexible at the time I was using it. Everyone used to have access to the same dataset." Verified User, 14 Jan 2026Anaplan G2 Verified Review
"Anaplan has consistently faced challenges due to its expensive licensing model and performance limitations when handling large datasets. The basic AI and Gen AI features are not only costly but also have a very limited user base." Verified User, 9 Nov 2025Anaplan G2 Verified Review
🎯 Best use case
A finance-led revenue reporting mandate at enterprise scale, where modeling depth matters more than deal-level action, and where a dedicated planning team already exists.
Oliv AI takes the opposite position on the same problem: instead of modeling revenue in a planning layer, its agents work inside the CRM your reps already use, so the reported number and the recorded number stay the same.
1.3 Aviso [toc=1.3 Aviso]
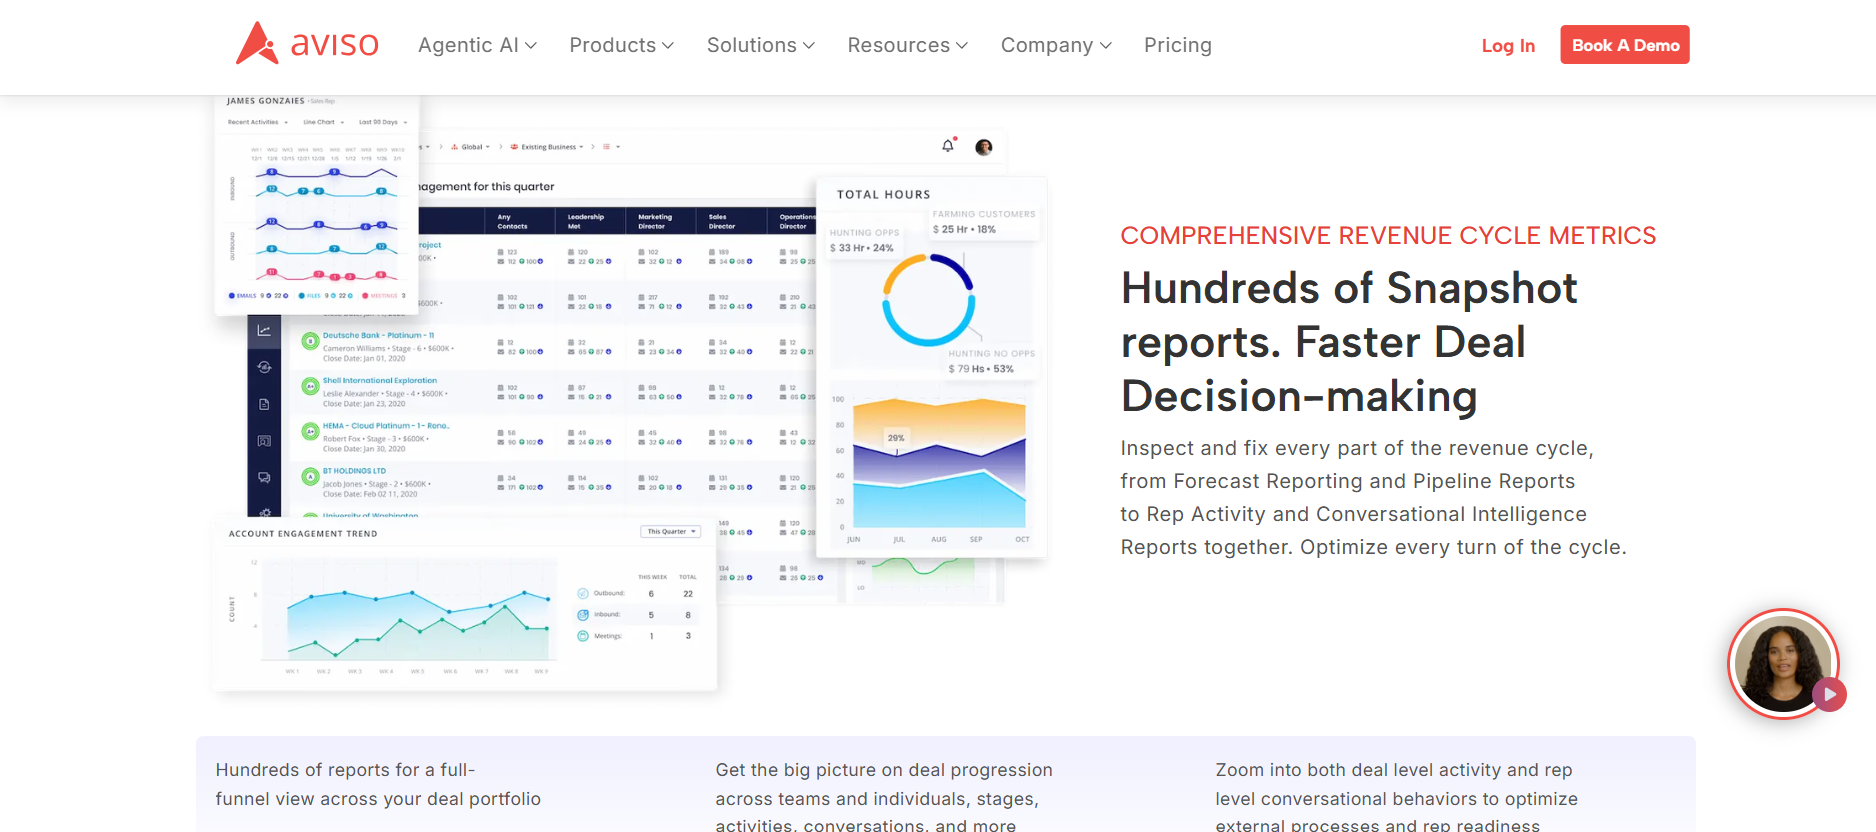
Aviso's revenue cycle view layers forecast, pipeline, and rep activity snapshots with account engagement trends, showing how revenue reporting software turns scattered deal data into faster decisions.
Aviso is an AI forecasting platform used mainly by enterprise sales orgs that want a predicted number alongside the rep-submitted one. On reporting specifically, it is the weakest performer in this list based on verified reviews.
🔍 What it actually does
Aviso ingests CRM data and produces AI forecast scores, segment roll-ups, and rep-level views. Managers filter by owner name to prep one-on-ones and forecast calls.
The core promise is a second opinion on the forecast. The reporting layer around it is where reviewers report friction.
🔑 Key features for reporting
Left-hand group filters. Filter by owner or segment to isolate one rep before a forecast call.
AI forecast scoring. A predicted number sits next to the submitted number.
Segment roll-ups. Views by team, region, or hierarchy.
SFDC sync. Data flows from Salesforce, though reviewers report reliability gaps.
💰 Pricing and implementation
Aviso sells enterprise contracts with quote-based pricing. No public list price exists.
Implementation depends heavily on internal enablement. One reviewer describes adoption with "no internal support or training provided," which is a rollout problem as much as a product one.
✅ Pros and ❌ cons
✅ Owner-level filtering makes one-on-one prep straightforward
✅ AI-generated forecast scores give managers a challenge number
❌ Exporting data "loses all customisations and filters," which breaks custom reporting workflows
❌ Reviewers report slow performance when switching between segments
❌ SFDC sync failures and update lag reported, forcing Excel workarounds
❌ Analytics described as ineffective by multiple reviewers
🗣️ Real user feedback
"Extremely slow performance, especially when switching between segments. Exporting data loses all customisations and filters. Analytics are ineffective and add no real value." Verified User, 24 Jun 2025Aviso G2 Verified Review
"The solution is slow, often times it doesn't sync with SFDC, the reports are terrible and don't represent what is being pulled by the data." Verified User, 18 Feb 2025Aviso G2 Verified Review
"I like being able to filter by group on the left-hand side. I often filter by the owner name so that I can easily zero in on one individual when I'm doing a one-on-one or through my forecast call." Verified User, 8 Dec 2025Aviso G2 Verified Review
That export complaint is the one I would test in a demo. A report that loses its filters on export is not a report. It is a screenshot with extra steps.
🎯 Best use case
A large enterprise that already mandates a second forecast opinion and has an internal enablement team ready to support the rollout.
Oliv AI approaches the same forecast-call problem differently: its forecast agent prepares the weekly and monthly roll-up before the call, so managers review a number rather than rebuild one.
1.4 Clari [toc=1.4 Clari]
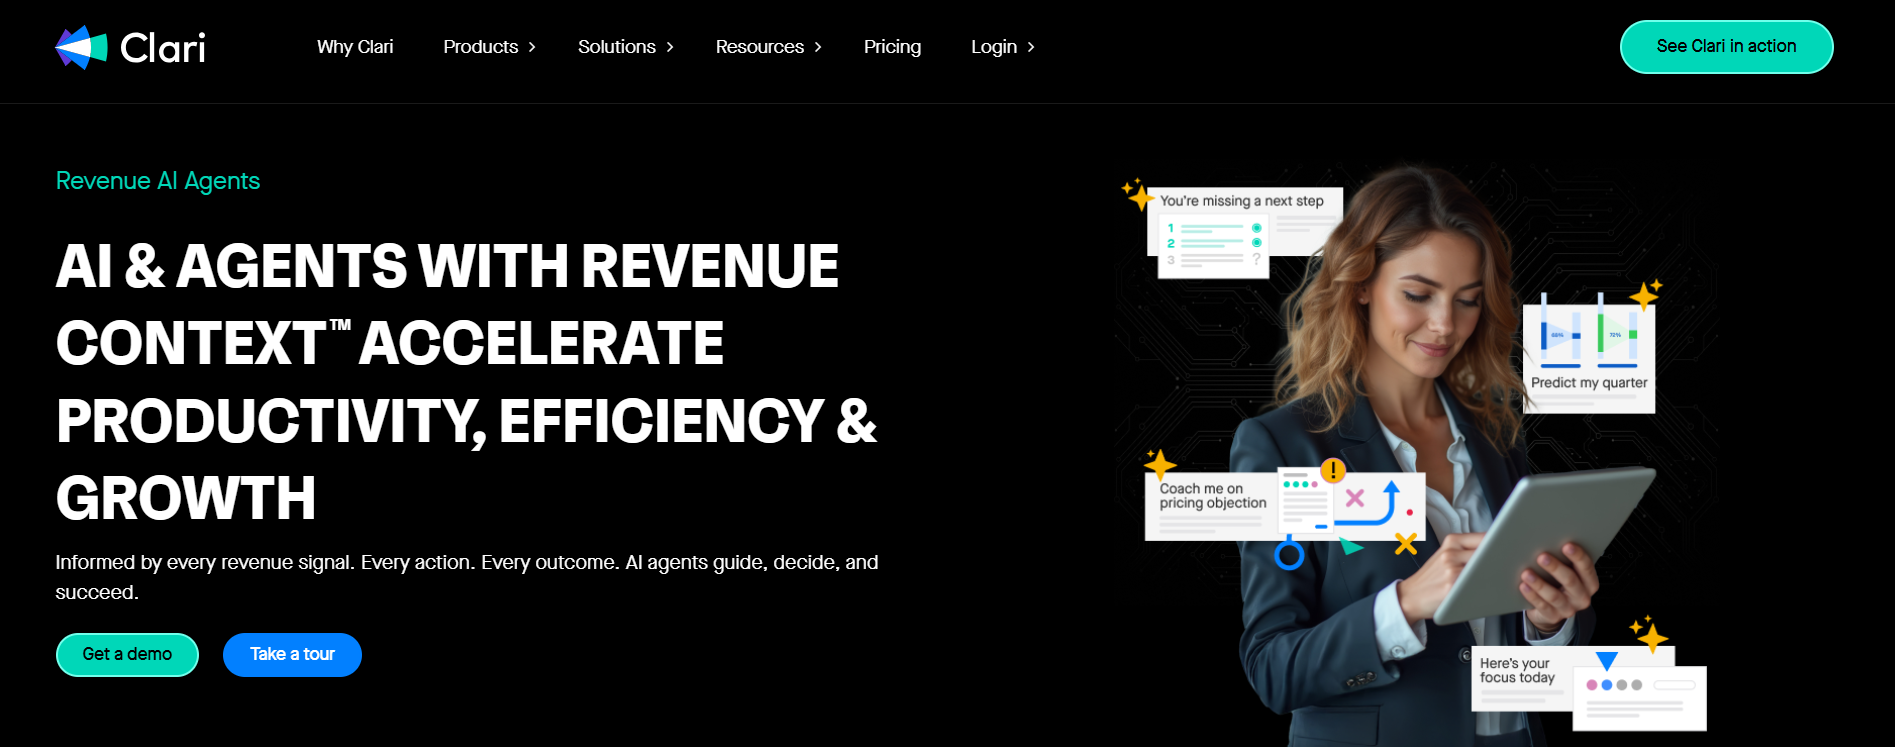
Clari's Revenue Context page pairs a seller with AI prompts for quarterly predictions, coaching, and daily focus, illustrating agent-generated insights that feed executive revenue reporting and analytics views.
Clari is the category-defining pipeline inspection and forecast platform. It is pre-generative AI in architecture, built to show you the pipeline rather than act on it, and its feature set reflects that origin.
📈 What it actually does
Clari pulls Salesforce data into forecast views, inspection views, and waterfall analysis. Reviewers use it instead of native Salesforce forecasting because the roll-up happens automatically.
It has since expanded into cadences, dialing, and conversation intelligence. Reviewers say the newer layers are less mature than the forecasting core.
🔑 Key features for reporting
Out-of-the-box dashboards. Strong prebuilt analytics with minimal configuration.
Weekly forecast and opportunity analysis. Week-over-week drill-down into individual deals.
Flow View and Waterfall View. Pipeline movement analysis, though reviewers report both underperforming.
Inspection View presets. Standardizing the display still takes extra work.
Email engagement tracking. Open and receipt signals feed deal-strength reads.
💰 Pricing and implementation
Clari uses enterprise quote-based pricing with no public list rate. For a 25-to-200-rep team, stacking Clari with Gong and Salesloft is how total cost quietly clears $500 per user per month, which is why the Clari alternatives conversation keeps coming up.
✅ Forecasting is simple, fast, and well integrated with Salesforce
✅ Out-of-the-box dashboards and cadence analytics are genuinely robust
✅ Smooth implementation reported repeatedly
❌ "There's no custom reporting," per a July 2026 reviewer
❌ CRM writeback described as "not good," with MEDDIC values unable to return to Salesforce
❌ AI features called immature, with weak integration to non-Salesforce systems
❌ Connection drops with Salesforce, Gmail, and calendar require app restarts
🗣️ Real user feedback
"There's no custom reporting. The CRM writeback is not good; we cannot send MEDDIC values back to Salesforce or update fields in Salesforce from the conversation intelligence. The AI is not as flexible as we need it to be." Verified User, 13 Jul 2026Clari G2 Verified Review
"The AI features are immature, team activity is poorly designed, and it doesn't integrate well with other popular business systems today." Verified User, 10 Oct 2025Clari G2 Verified Review
"I'm concerned that the advanced 'Flow View' and 'Waterfall View' aren't working well. I also find it inconvenient that it still takes extra work to get the 'Inspection View' display standardized using presets." Verified User, 16 Nov 2025Clari G2 Verified Review
Read that first quote again. Two of the four artifacts this article is about, custom reports and writeback, are named as gaps by a paying user.
🎯 Best use case
A Salesforce-standardized enterprise where forecast roll-up speed matters more than custom reporting or field-level writeback.
Oliv AI closes exactly the loop Clari reviewers flag: its CRM Manager agent writes methodology fields, including custom frameworks like MEDIC-BAND, back into Salesforce and HubSpot after each call.
1.5 Forecastio [toc=1.5 Forecastio]
Forecastio is a HubSpot-native sales performance and forecasting tool built for smaller revenue teams. It is the pragmatic pick when Clari and Anaplan are overbuilt for your headcount.
🧭 What it actually does
Forecastio sits directly on HubSpot data and produces forecasts, performance reports, and goal tracking. There is no separate data pipeline to maintain.
It targets sales leaders at 10-to-100-rep companies who need reporting rigor without a RevOps hire.
🔑 Key features for reporting
HubSpot-native sync. No middleware, no warehouse dependency.
Sales performance reporting. Conversion, velocity, and win-rate views by rep and stage.
Goal and quota tracking. Attainment views tied to plan.
Scenario-light forecasting. Simpler than a planning platform, faster to configure.
💰 Pricing and implementation
Forecastio publishes SMB-friendly tiers well below enterprise revenue platforms. Deployment is measured in hours because the CRM is the data source.
✅ Pros and ❌ cons
✅ Native HubSpot data model, so numbers match the CRM
✅ Affordable relative to enterprise revenue platforms
✅ Fast to deploy without a RevOps team
❌ HubSpot-only, so Salesforce shops are excluded
❌ No conversation data, so pipeline reads stay CRM-dependent
❌ Reporting depth is thinner than dedicated analytics platforms
🎯 Best use case
A HubSpot-based team under 100 reps that needs credible forecast reporting and cannot justify enterprise licensing.
Oliv AI serves the same HubSpot-first buyer at a similar entry point, starting at $19 per user per month, with agents added one at a time rather than as a suite.
1.6 Gong [toc=1.6 Gong]
Gong is the conversation-intelligence platform that became a Revenue AI Operating System. It has the deepest data set on this list and, per reviewers, the tightest grip on it, which is why buyers keep researching Gong alternatives.
🎙️ What it actually does
Gong records, transcribes, and analyzes calls, then layers dashboards, forecast boards, and AI briefs on top. Founded in 2015, its conversation-intelligence core is still the center of the product.
Reporting arrived properly in October 2024 with Revenue Analytics, described as "robust, configurable, and dynamic dashboards."
Configurable forecast boards. Spreadsheet-like boards covering new business, renewals, upsells, and net revenue, shipped November 2025.
AI briefs. Customizable summaries at homepage, deal, account, and call level, shipped May 2025.
Data Extractor. Extracts AI fields from conversations and maps them to CRM, shipped December 2025.
Data Studio metrics. Metrics built on related object fields, added May 2026.
📅 Gong reporting capability, then and now
Gong Reporting Product Updates, 2025 to 2026
Period
What shipped
Through 2025
Revenue Analytics dashboards on custom metrics, AI briefs across deal, account, and call surfaces, Agent Studio for managing AI agents, and configurable spreadsheet-like forecast boards covering renewals and net revenue
Feb to May 2026
Mission Andromeda launched Gong Enable with conversational guidance and unified account management on 25 Feb 2026, followed by Snowflake multi-instance connectivity and Data Studio metrics built from related object fields
Expected next
Bidirectional Model Context Protocol support so the AI Briefer pulls third-party data into briefs and external AI platforms query Gong, plus brief generation via API across calls, contacts, accounts, and deals
💰 Pricing and implementation
Gong does not publish list pricing. Per-seat pricing became visible inside the admin center for eligible direct-purchase accounts in June 2025, and Gong Enable is a separate paid module, which complicates any Gong pricing comparison.
Reviewers describe setup friction, particularly around AI tracker configuration and real-time integrations.
✅ Pros and ❌ cons
✅ Deepest conversation data set, with strong AI theme detection across departments
✅ Genuinely configurable dashboards and forecast boards since late 2025
✅ Active shipping cadence, with monthly release notes and ARR past $500M as of May 2026
❌ "Limitations of getting data back into salesforce," per a May 2026 reviewer
❌ Full data download gated behind a plan upgrade, with snippets copied one by one
❌ AI tracker setup UI described as difficult
❌ Data is lost when you stop paying, per a March 2026 reviewer
🗣️ Real user feedback
"limitations of getting data back into salesforce" Verified User, 21 May 2026Gong G2 Verified Review
"I cannot download all the data myself unless we upgrade the plan, which isn't ideal and results in me not fully utilizing Gong. The requirement to download snippets one by one using copy and paste is particularly annoying." Verified User, 3 Oct 2025Gong G2 Verified Review
"The fact that you can't edit a recording (to only share a portion with a client), and the fact that if you stop working with the tool you lose the data." Verified User, 19 Mar 2026Gong G2 Verified Review
Oliv AI's read here goes against the usual Gong critique. The problem is not the analysis quality, which is strong. It is that RevOps teams write custom code to extract data for their own analysis, when what they need is a spreadsheet-like surface. I could be over-indexing on the teams that came to us specifically for that reason.
🎯 Best use case
An enterprise where conversation data is the strategic asset and a dedicated analytics team can work around export limits.
Oliv AI takes the opposite stance on data portability: its agents push structured deal data back into Salesforce, HubSpot, and Zoho as the default output, not as an upgrade tier.
1.7 InsightSquared [toc=1.7 InsightSquared]
InsightSquared is a sales analytics platform known for a large prebuilt report library. It is the right pick when you want reports that already exist rather than reports you have to build.
📚 What it actually does
InsightSquared connects to the CRM and delivers hundreds of prebuilt reports covering pipeline, activity, conversion, and forecast. A report builder handles the rest.
It grew up in the pre-generative-AI era, so the model is dashboard-and-drill-down rather than agent-and-action.
🔑 Key features for reporting
Prebuilt report library. Wide coverage without building from scratch.
Custom report builder. For metrics outside the standard set.
Activity and pipeline analytics. Rep-level and team-level views.
Forecast roll-ups. Submitted versus predicted comparisons.
💰 Pricing and implementation
Mid-market tiers, quote-based. Implementation depends on CRM data quality, which is the recurring theme across every tool in this category.
✅ Pros and ❌ cons
✅ Large prebuilt library shortens time to first report
❌ No conversation data, so reporting inherits CRM hygiene problems
❌ Attribution views are limited
❌ Executive summaries remain a manual build
🎯 Best use case
A mid-market sales org with clean CRM data that wants breadth of standard reporting fast.
Oliv AI attacks the upstream cause instead: its CRM Manager agent updates fields automatically after calls, so the reports built on top inherit accurate data.
1.8 People.ai [toc=1.8 People.ai]
People.ai is an activity-capture and account-intelligence platform. It answers "who did we actually talk to" better than anything else on this list.
🕸️ What it actually does
People.ai captures emails, meetings, and contacts, then maps them to accounts and opportunities. That relationship graph feeds coverage reports and engagement analysis.
For attribution work, this contact-to-opportunity mapping is genuinely useful. Most reporting tools cannot answer it at all.
🔑 Key features for reporting
Automated activity capture. Emails and meetings logged without rep effort.
Contact-to-opportunity mapping. Buying-group coverage per deal.
Account engagement dashboards. Multi-threading depth by account.
CRM activity writeback. Captured activity flows into the system of record.
💰 Pricing and implementation
Enterprise, quote-based. Deployment involves email and calendar permissioning, which is a security review, not a config change.
✅ Pros and ❌ cons
✅ Best-in-class activity capture and relationship mapping
✅ Contact-level attribution most reporting tools cannot produce
✅ Writes activity back to CRM automatically
❌ Not a forecast or executive-summary tool
❌ Value depends on broad email and calendar access approval
❌ Reporting is engagement-led, not revenue-recognition-led
🗣️ A note on activity capture
Activity capture tools break in a specific way I have watched repeatedly. Emails get flagged as sensitive and excluded, so the customer picture has holes nobody notices until a QBR.
An enterprise running multi-threaded deals where buying-group coverage is a reported metric.
Oliv AI treats activity capture as an input rather than the product: its Context Graph associates activity to the correct CRM object before agents act on it.
1.9 Revenue Grid [toc=1.9 Revenue Grid]
Revenue Grid is a guided-selling and Salesforce sync platform with signal-based dashboards. It targets teams that want nudges alongside numbers.
🚦 What it actually does
Revenue Grid monitors pipeline and generates signals when deals stall or steps get skipped. Reporting sits on top of that signal layer.
It is closer to the act layer than Clari or InsightSquared, though the actions are alerts rather than completed work.
🔑 Key features for reporting
Signal dashboards. Alerts on stalled deals and missed steps.
Configurable reports. Pipeline and activity views by team.
Mid-market tiers, quote-based, with a Salesforce-centric deployment.
✅ Pros and ❌ cons
✅ Signal engine surfaces risk without manual inspection
✅ Reliable Salesforce bidirectional sync
✅ Mid-market pricing
❌ Signals still hand the work back to a human to complete
❌ Attribution views limited
❌ Smaller review base than Clari or Gong, so evidence is thinner
🎯 Best use case
A Salesforce-based mid-market team that wants guided-selling nudges plus reporting in one contract.
Oliv AI's distinction here is narrow but real: instead of alerting a rep to update a field, its Deal Driver agent flags the risk and the CRM Manager agent completes the update.
1.10 Salesforce [toc=1.10 Salesforce]
Salesforce is the default revenue reporting tool for most companies because it is already paid for. Native reports and dashboards handle more than teams assume.
🏛️ What it actually does
Salesforce reports and dashboards run directly on your opportunity data. Report types, filters, and joined reports cover a wide range of revenue questions without any third-party tool.
Where it struggles is anything requiring conversation context, narrative summaries, or data your reps never entered.
🔑 Key features for reporting
Native report builder. Custom report types, filters, and joined reports.
Dashboards. Component-level charts on live opportunity data.
Forecasting module. Native roll-ups by hierarchy.
Einstein activity capture. Automated email and meeting logging, with known exclusion behavior.
Agentforce. Action-credit-priced agents layered on the platform, covered in detail in this Agentforce pricing breakdown.
💰 Pricing and implementation
Per-seat licensing you already pay, plus consumption pricing for agent actions. Action-credit models make monthly spend hard to predict as usage scales.
Implementation is admin work, not procurement. That is the real advantage.
✅ Pros and ❌ cons
✅ Zero incremental license cost for core reporting
✅ Native writeback because it is the system of record
✅ Deep customization through report types and formula fields
❌ Reports are only as good as what reps manually enter
❌ Executive summaries are entirely manual
❌ Activity capture exclusion rules create silent data gaps
❌ Agent action credits make spend unpredictable at volume
🎯 Best use case
Any team with disciplined CRM hygiene and a competent admin. Start here before buying anything, and buy only where Salesforce genuinely cannot answer the question.
Oliv AI is built on that premise: it plugs into Salesforce, HubSpot, and Zoho to make them accurate rather than asking teams to report somewhere else.
1.11 Salesloft [toc=1.11 Salesloft]
Salesloft is an engagement platform with cadence and activity analytics. On revenue reporting, it is the narrowest tool here, and reviewer sentiment on data reliability is poor.
📬 What it actually does
Salesloft sequences outreach and reports on engagement: opens, replies, calls, and cadence performance. Managers use it for top-of-funnel observability.
It reports activity, not revenue. That distinction matters when it appears on revenue reporting shortlists, and it shapes any Gong versus Salesloft evaluation.
🔑 Key features for reporting
Cadence analytics. Step-level performance across sequences.
Activity and dialer metrics. Call and email volume by rep.
Engagement tracking. Opens and replies, with reported accuracy issues.
CRM sync. Salesforce connectivity, with reported reliability gaps.
💰 Pricing and implementation
Per-seat tiers. Reviewers repeatedly describe difficult initial setup and a steep learning curve.
✅ Pros and ❌ cons
✅ Brings structure to high-volume outreach and follow-up
✅ Cadences and templates centralized in one place
❌ "Analytics/metrics are faulty like email opens," per a March 2025 reviewer
❌ Data connectivity issues between CRM, Sales Navigator, and the app
❌ Meeting logging problems reported, which corrupts activity reporting
❌ No conditional-logic automation, per a September 2025 reviewer
🗣️ Real user feedback
"Analytics/metrics are faulty like email opens... A handful of features don't work properly (inbound calls, task reminders, data connectivity between apps (CRM, Sales Nav)." Verified User, 26 Mar 2025Salesloft G2 Verified Review
"I often have trouble logging meetings, and certain features feel clunky or overly manual. The learning curve can be frustrating, especially when you're trying to move quickly in a fast-paced environment." Verified User, 22 Jul 2025Salesloft G2 Verified Review
"For months, randomly, one-off emails sent from Salesloft (not sequences) would appear blank in the recipient's mailbox... No automations based on conditional logic." Verified User, 24 Sep 2025Salesloft G2 Verified Review
If engagement metrics are unreliable at the source, every downstream report inherits the error. That is worth more scrutiny than any dashboard feature.
🎯 Best use case
An outbound-heavy team that needs cadence execution, with revenue reporting handled elsewhere.
Oliv AI is not an engagement platform, and pairing it with a sequencer is a reasonable stack. The difference is that Oliv's agents complete post-call work rather than reporting that it did not happen.
1.12 Terret (formerly BoostUp) [toc=1.12 Terret]
Terret, previously BoostUp, is a revenue command-center platform competing directly with Clari on configurable dashboards and forecast rigor.
🎛️ What it actually does
Terret unifies CRM, activity, and conversation data into configurable revenue views. The pitch is flexibility, positioned against Clari's more fixed structure.
For teams that hit Clari's custom-reporting wall, Terret is the usual next evaluation alongside other revenue orchestration platforms.
🔑 Key features for reporting
Configurable command-center dashboards. Built around your metric definitions.
Forecast submission and roll-up. Multi-level hierarchy support.
Conversation and activity signals. Feeding deal-health views.
CRM sync. Bidirectional with Salesforce.
💰 Pricing and implementation
Enterprise, quote-based. Implementation is a configuration project because flexibility is the product.
✅ Pros and ❌ cons
✅ More configurable reporting than Clari's out-of-the-box structure
✅ Multi-stream forecasting including renewals
✅ CRM sync in both directions
❌ Configuration effort is the cost of that flexibility
❌ Attribution views remain partial
❌ Smaller review base than Clari or Gong, so buyer evidence is thinner
❌ Executive summaries still require assembly
🎯 Best use case
An enterprise RevOps team with the capacity to configure its own metric definitions and a specific complaint about a rigid incumbent.
Oliv AI's read is that configurability is the wrong axis for most mid-market teams. We see managers who do not want a better report builder. They want the Monday one-pager already written, which is what the forecast agent delivers.
Which profile picks which tool
Buyer Profile to Tool Match for Revenue Reporting
Your situation
Start with
Managers hand-build the Monday forecast
Oliv AI, agent-generated briefs plus CRM writeback
Finance owns revenue modeling at enterprise scale
Anaplan, despite licensing cost
Salesforce-standardized, forecast speed over custom reports
Clari
Conversation data is the strategic asset
Gong
HubSpot shop under 100 reps
Forecastio
Buying-group coverage is a reported metric
People.ai
CRM hygiene is already strong and budget is zero
Salesforce native reports
Oliv AI sits at position one for a narrow reason worth stating plainly: across this list, reviewers name custom reporting and CRM writeback as the two most common gaps, and Oliv's agents are built to close both.
Q2. How did we score and select these revenue reporting tools? [toc=2. Scoring Methodology]
Every tool was scored out of 100 across five criteria: Reporting Depth and Custom Report Flexibility (25%), Agentic Action versus Dashboard-Only (25%), Attribution and Cross-Functional Data Coverage (20%), Setup and Time-to-First-Report (15%), and Pricing Transparency (15%). Scores of 0 to 20 earn one star, 21 to 40 two, 41 to 60 three, 61 to 80 four, and 81 to 100 five.
⭐ Why these five weights, and not popularity
Reporting depth and agentic action carry equal top weight for one reason. A tool that shows you a number and a tool that writes the report are doing different jobs at different costs.
Attribution sits at 20% because it is the rarest capability in this category. Setup time and pricing transparency split the last 30%, since both decide whether the tool actually gets used.
🔬 How each criterion was evidenced
Three evidence types only. Verified G2 reviews from the last 24 months, vendor documentation and release notes, and hands-on setup timing.
No vendor marketing claims were scored. When a vendor said "robust reporting" and a reviewer said "there's no custom reporting," the reviewer won. G2's Revenue Operations and Intelligence category, built on thousands of verified reviews, was the base pool for this survey of revenue intelligence software platforms.
⚖️ How to re-weight this for your own context
The weights above assume a mid-market B2B SaaS buyer. Shift them if your situation differs.
Under 50 reps: raise Setup and Pricing Transparency to 40% combined, and drop Attribution to 10%.
Complex revenue model (usage-based, multi-entity): raise Reporting Depth to 35%.
Real ASC 606 exposure: add a pass/fail compliance gate before scoring anything.
Enterprise with a RevOps team: raise Attribution, since you have the people to use it.
📉 The metric trap that skews most rubrics
Activity metrics with no link to deal advancement are hollow. Call counts and email volume look like reporting, but they predict nothing.
I score any tool down when its headline dashboard is activity volume. Glorified scorekeepers make poor forecasters, and that is true of software as much as managers.
🧮 The 10/80/10 test applied to tools
Oliv AI's evaluation frame is the 10/80/10 rule: you spend 10% defining the reporting outcome, the tool does 80% of the lifting, and you spend 10% on a quality check. Any platform demanding 80% human effort loses points, no matter how good the charts look.
⭐ Final scores across all twelve tools
Revenue Reporting Software Scores Out of 100 (2026)
Tool
Score
Stars
Where it lost points
Oliv AI
88
⭐⭐⭐⭐⭐
Dashboard customization, flagged in its own reviews
Gong
74
⭐⭐⭐⭐
Export gating and Salesforce writeback limits
Clari
62
⭐⭐⭐
No custom reporting, weak CRM writeback
Terret (BoostUp)
60
⭐⭐⭐
Configuration effort, thin buyer evidence
Anaplan
58
⭐⭐⭐
Limited API, costly licensing, and large-dataset lag
People.ai
57
⭐⭐⭐
Not a forecast or summary tool
Salesforce
55
⭐⭐⭐
Manual summaries, unpredictable agent credits
Forecastio
54
⭐⭐⭐
HubSpot-only, no conversation data
Revenue Grid
52
⭐⭐⭐
Alerts stop short of completing work
InsightSquared
50
⭐⭐⭐
No conversation layer, limited attribution
Aviso
34
⭐⭐
Exports lose filters, SFDC sync failures
Salesloft
30
⭐⭐
Faulty engagement metrics at the source
🗣️ What reviewers said that moved scores
"There's no custom reporting. The CRM writeback is not good." Verified User, 13 Jul 2026Clari G2 Verified Review
"Additionally, setting up Oliv.ai was straightforward and could be done in just five to fifteen minutes." Verified User, 15 Jun 2026Oliv AI G2 Verified Review
"Extremely slow performance, especially when switching between segments. Exporting data loses all customisations and filters." Verified User, 24 Jun 2025Aviso G2 Verified Review
Oliv AI scores 88 on this rubric: setup timed at 5 to 15 minutes by reviewers, entry pricing at $19 per user per month, and an agent layer that completes work instead of returning it. The 12 points it loses are dashboard customization, and that gap is named by its own users.
Q3. What is revenue reporting software, and which category do you actually need? [toc=3. Definitions and Categories]
Revenue reporting software unifies CRM, billing, and warehouse data to produce dashboards, custom reports, attribution views, and executive summaries. Recognition software governs when revenue may be booked under ASC 606 and IFRS 15. Intelligence software predicts pipeline outcomes. Reporting explains what happened and why, recognition governs what you may book, and intelligence forecasts what comes next.
🧾 Three categories the market keeps confusing
These three get sold as one thing. They are not.
Revenue Reporting vs Recognition vs Intelligence
Dimension
Reporting
Recognition
Intelligence
Core question
What happened, and why
What may we book, and when
What happens next
Owner
RevOps, sales leadership
Finance, controller
Sales leadership, RevOps
Output
Dashboards, reports, summaries
Deferred schedules, audit trail
Forecasts, risk scores
Standard
Internal metric definitions
ASC 606, IFRS 15
Model accuracy
Example tool
Oliv AI, Clari, Gong
ERP revenue modules
Aviso, Clari
💰 One contract, three different answers
Take a $1,200 annual SaaS contract signed in January. Reporting tells you it came from a partner referral and closed in 34 days.
Recognition spreads it as $100 per month across twelve months. Intelligence flags in month nine that usage dropped and renewal is at risk. Same contract, three separate systems, three different jobs.
🗂️ The six categories, and who each fits
CRM-based tracking. Native Salesforce or HubSpot reports. Fits teams with clean data and no budget.
Accounting suite reporting. QuickBooks or Xero reports. Fits companies under $10M with simple revenue.
Subscription billing analytics. Stripe, Chargebee, and Maxio. Fits recurring or usage-based models.
Dedicated revenue automation. Oliv AI, Clari, Gong, and Terret. Fits mid-market and enterprise teams where reporting must drive action, which is the core promise of revenue orchestration platforms.
ERP revenue modules. NetSuite, SAP, and Oracle. Fits multi-entity companies with real compliance exposure.
General BI layer. Tableau, Power BI, and Qlik. Fits teams with a data engineer and a warehouse.
🧪 Two decision tests before you buy
The BI-is-enough test. If you already have a warehouse, a data engineer, and stable metric definitions, a BI tool is enough. Buy a revenue platform only when nobody owns the definitions or the reports arrive too late to act on.
The ERP-sufficiency test. Your ERP is enough when revenue is contract-based and predictable, and finance is the only consumer of the report. Add a dedicated platform when revenue is usage-based or when sales leadership needs attribution and narrative summaries the ERP cannot produce.
⚠️ The compliance gate that ends shortlists early
If you have real ASC 606 or IFRS 15 exposure, this is a pass/fail check, not a scoring criterion. Four requirements, all non-negotiable.
Contract-level deferred revenue schedules, not aggregate journal entries.
Automatic adjustments for upgrades, downgrades, and cancellations mid-term.
Multi-currency and multi-entity consolidation.
An exportable audit trail an external auditor can trace to the source transaction.
🏛️ The dumb-repository problem
Running a revenue org on a system reps update only because management demands it is not reporting. It is compliance theatre with charts attached.
The honest test is simple. If your reps stopped updating the CRM tomorrow, how much of your reporting would survive? For most teams, the answer is almost none, which tells you the reporting tool was never the problem, and it explains why the shift from RevOps to intelligence to orchestration keeps stalling.
Oliv AI operates in the reporting and action layer, plugging into Salesforce, HubSpot, and Zoho rather than replacing them, so recognition stays in finance's system of record. That split matters: agents make the CRM accurate, and the controller keeps control of the ledger.
Q4. Why do dashboards keep failing sales managers on Monday morning? [toc=4. The Dashboard Failure]
Dashboards fail because they shift the analysis onto the manager. Every Thursday and Friday, managers spend one to two hours per rep reconstructing pipeline movement, then hand-build Monday's report. Meanwhile 55% of sales leaders lack high confidence in their forecast. The fix is not another tile. It is a one-page brief that arrives already reasoned.
⏰ What the Thursday scrub actually costs
Picture a manager with eight reps. Thursday and Friday go to one-on-ones, one to two hours each, reconstructing what moved and why.
That is 8 to 16 hours a week spent assembling a number, not improving it. The dashboard did not save that time. It created it, by presenting data that still needs a human to interpret.
🚿 Senior time spent digging, not deciding
The habit I see most is managers listening to call recordings while driving and reading dashboards in odd gaps of the day. They are doing manual data archaeology on their own time, and it is the pattern that pushes teams toward AI for sales calls in the first place.
That is the most expensive labor in the org, spent on the least leveraged task. Nobody puts it on a slide because it does not look like a problem. It looks like diligence.
🔄 The twist: reconciliation, not visualization
Here is where the standard advice gets it backwards. Everyone treats bad reporting as a visualization problem, so they add a tool.
Each added tool makes the stack more brittle, not more resilient. Around a third of finance leaders name revenue recognition and reconciliation as the hardest processes to scale. Board numbers break at the join between systems, not at the chart.
📈 The accuracy ladder is coachable
Forecast accuracy is not a chart feature. It is a ladder you climb with process discipline, and it is the real benchmark for any AI sales forecasting software.
Below 70%: pipeline visibility or stage definitions are broken.
70 to 85%: where most B2B SaaS teams sit today.
90 to 95%: top-performer range, meaning actuals land within 10% of forecast.
96% by week two: the vendor-claimed upper bound, useful as a reference point, not a promise.
Only 41% of sales managers and executives are satisfied with their current dashboards for decision-making. That is not a design complaint. It is a job-allocation complaint.
📄 The design target: one page, already reasoned
The artifact worth building toward is narrow. You sit down Monday morning, and a one-page document is already in your inbox, focused on the top five to ten deals that actually matter.
Not 40 tiles. Not a drill-down path. A brief that has already done the reasoning, with the source numbers traceable underneath.
✅ The tactic to run this week
Before you evaluate a single tool, run this in your next pipeline review. If a rep cannot articulate the exact status of a deal, push it off the forecast.
No debate, no split commit. This one rule surfaces more forecast error in a week than a new dashboard will in a quarter, and it costs nothing. Pair it with a qualification framework like MEDDIC so "exact status" means something specific.
Oliv AI was built against this exact workflow: its forecast agent assembles the weekly and monthly roll-ups, so the Thursday scrub becomes a review instead of a reconstruction. One reviewer reports forecast accuracy up 27% after the switch, which I read as process discipline finally being enforced by software rather than by memory.
Q5. Dashboards, custom reports, attribution views, or executive summaries: which one actually moves revenue? [toc=5. Four Reporting Artifacts]
Treat them as four separate jobs. Dashboards monitor, custom reports investigate, attribution views assign credit, and executive summaries narrate. Most platforms are strong on one and weak on three. Ask each vendor to build a custom report live, then ask who verifies the narrative before leadership reads it. That test separates the shortlist fast.
📊 The four artifacts, and the job each one holds
Every buyer says they want "better reporting." Push on it, and four different requests fall out.
Dashboards answer "is anything off?" You glance at them daily.
Custom reports answer "why is that off?" You build them when something looks wrong.
Attribution views answer "what should we fund next?" They connect source to closed revenue.
Executive summaries answer "what do I tell the board?" They need reasoning, not tiles.
❌ Where the market actually breaks
Across verified G2 reviews from the last 24 months, two gaps repeat more than any others. Custom reporting and CRM writeback.
"There's no custom reporting. The CRM writeback is not good; we cannot send MEDDIC values back to Salesforce or update fields in Salesforce from the conversation intelligence." Verified User, 13 Jul 2026Clari G2 Verified Review
"limitations of getting data back into salesforce" Verified User, 21 May 2026Gong G2 Verified Review
Two different platforms, two different price points, the same structural gap. It is the recurring complaint that drives buyers toward Gong alternatives and rival forecast tools alike.
🔗 Attribution is the near-absent capability
Attribution is the rarest of the four. Most tools stop at pipeline source and never reach recognized revenue.
The reason is a missing join key. You need a single identifier that survives the trip from lead source, through opportunity, into the billing record, and out to recognized revenue. Without it, marketing reports pipeline, finance reports revenue, and the two numbers never reconcile.
🧑⚖️ Executive summaries need a named human verifier
Adoption is not the question anymore. 87% of sales organizations already use some form of AI, and 94% of sales leaders with agents call them critical to meeting business demands.
That makes governance the question. Every AI-written summary that reaches leadership needs one named person who verifies it. Not a policy document, a name.
⭐ Capability grid across the shortlist
Four Reporting Artifacts Compared Across Platforms
Tool
Dashboards
Custom reports
Attribution
Exec summaries
Oliv AI
⭐⭐⭐
⭐⭐⭐⭐
⭐⭐⭐⭐
⭐⭐⭐⭐⭐
Gong
⭐⭐⭐⭐
⭐⭐⭐⭐
⭐⭐⭐
⭐⭐⭐⭐
Clari
⭐⭐⭐⭐
⭐
⭐⭐
⭐⭐
Aviso
⭐⭐
⭐
⭐⭐
⭐⭐
People.ai
⭐⭐⭐
⭐⭐⭐
⭐⭐⭐⭐
⭐⭐
Salesforce
⭐⭐⭐⭐
⭐⭐⭐⭐⭐
⭐⭐⭐
⭐
Salesloft
⭐⭐
⭐⭐
⭐
⭐
Oliv AI covers all four artifacts, though its own G2 reviewers ask for deeper dashboard customization, which is the honest current limit of an agent-first model.
"I'd love to see few more options to customize dashboards and reports for different teams." Verified User, 26 Jun 2026Oliv AI G2 Verified Review
💰 The pricing signal hiding inside the artifact question
Watch how vendors price the investigation layer. Per-seat licensing on an analyst capability financially punishes curiosity, because every extra person who wants to ask a question costs money.
A per-organisation model, priced flat for unlimited users and queries, inverts that. I read that as the clearest tell in the category about whether a vendor wants reporting used or just owned, and it is worth checking against any revenue intelligence software platform on your list.
Oliv AI's Analyst agent answers ad-hoc strategic questions in plain English, returning curated data with interpretive commentary, and reviewers report getting answers in one click instead of queuing with RevOps. One customer's reaction to a report that named three specific rep skill gaps was simply being speechless, which tells me the bar for "reporting" was set very low for a very long time.
Q6. What does revenue reporting software cost, and should you just build it yourself? [toc=6. Cost and Build vs Buy]
Three models compete. Per-seat runs roughly $19 to $500 per user monthly. Per-action credit models charge around $0.10 per agent action, which makes spend unpredictable at scale. Per-organisation pricing, such as $4,999 flat for unlimited users and queries, suits teams where many people ask questions. Build only if reporting is your product.
Oliv AI sits at the bottom of the per-seat range, starting at $19 per user per month, with agents added one at a time rather than as a bundle.
💸 The costs that never appear on the pricing page
Sticker price is maybe 60% of what you actually spend. Four line items get missed.
Implementation. Weeks of RevOps time, even on "easy" tools.
Data integration. Connecting CRM, billing, and warehouse is engineering work.
Consulting for multi-entity setups. Multi-currency configuration is rarely self-serve.
The curiosity tax. Per-seat licensing means fewer people query, so the tool gets used less.
Stack Gong, Clari, and a sequencer for a 25-to-200-rep team, and total cost of ownership clears $500 per user monthly. That is the quiet part of the standard playbook, and it is visible in published Gong pricing tiers once you add the modules.
🔨 The buyer who chose to build, and what broke
I lost a deal to an internal build. Reasonable logic: they already had every call recording, so why pay a vendor?
Three to four months in, they had insights. Real ones, extracted from calls. Then the actual question arrived: how do you relate a call insight to the state of the deal it belongs to? That join, from conversation to opportunity to forecast, was the whole product, and it was the part they had not built.
⚠️ The honest exception
Build when reporting is your product, when you have a data engineer with spare capacity, or when your revenue model is so unusual no vendor matches it.
I say that as someone who builds. Twelve apps shipped on Replit in 150 days, used a million times. Building is not the hard part. Maintaining a data join across four systems while your reps change how they sell is the hard part.
🗣️ What buyers say about cost
"It's more affordable compared to other options we previously used." Verified User, 23 Jun 2026Oliv AI G2 Verified Review
"I cannot download all the data myself unless we upgrade the plan, which isn't ideal and results in me not fully utilizing Gong." Verified User, 3 Oct 2025Gong G2 Verified Review
"Consolidating multiple tools into Oliv has saved us budget and increased our results." Verified User, 8 Jul 2026Oliv AI G2 Verified Review
That Gong quote is a cost problem disguised as a feature gate. Paying for data you cannot fully export is a real line item, and it is one reason consolidation across AI sales tools keeps beating best-of-breed stacking.
Oliv AI's pricing view is that SaaS is now a commodity and should be priced like one: start at $19 per user monthly, audit the workflow, deploy one agent, validate the ROI, then extend. We do it that way because nobody should buy a suite they cannot deploy.
Q7. How do you pressure-test a revenue reporting tool before you sign? [toc=7. Buyer Evaluation Tests]
Run five live tests in one 30-minute demo. Ask the vendor to trace a board number back to its source transaction. Request a custom report built on the call. Ask it to write one field back to your CRM. Ask for the attribution join key. Ask who verifies an AI-written summary before leadership reads it.
⚠️ Why demos fail buyers
In a standard demo, the vendor drives and you watch. You see a polished dataset that was configured for the demo, not for you.
Nothing in that hour tests the thing that will actually hurt you in month four. Take the mouse. Make them build live.
✅ The five tests, with pass criteria
Metric lineage. Pick one number on their dashboard. Ask them to trace it to the source transaction. Pass: they get there in under two minutes, on screen.
Custom report, live. Name a metric you actually use. Pass: it exists before the call ends, no follow-up email.
CRM writeback. Ask them to write one MEDDIC methodology field back to your CRM. Pass: the field updates in your sandbox during the call.
Integration depth. CRM, ERP, Stripe, and warehouse. Pass: named connectors, not "we can build that."
AI verification. Ask who signs off on a generated summary. Pass: a role and a workflow, not a disclaimer.
🔍 Review patterns that predict rollout pain
Read the one-and-two-star reviews before you read the case studies. Four failure signatures repeat.
"Extremely slow performance, especially when switching between segments. Exporting data loses all customisations and filters." Verified User, 24 Jun 2025Aviso G2 Verified Review
"Analytics/metrics are faulty like email opens... A handful of features don't work properly (inbound calls, task reminders, data connectivity between apps (CRM, Sales Nav)." Verified User, 26 Mar 2025Salesloft G2 Verified Review
Broken exports, faulty metrics, sync drops, and missing custom reports. Any one of these turns a signed contract into shelfware, which is why reading verified reviews beats reading case studies.
⏰ The training-time question nobody asks
Ask this directly: how many real meetings before the tool understands our sales methodology? Vague answers mean months of tuning.
Oliv AI needs three meetings to learn a team's methodology, and reviewers report full setup in five to fifteen minutes with an engineer on the call. I would still budget two to four weeks for full customization, because deep configuration is genuinely slower than onboarding, as any implementation timeline comparison shows.
🧪 The activity-capture bug worth reproducing
If you evaluate native CRM activity capture, test the exclusion rules with your real email traffic. Some systems flag an email as containing sensitive information when it plainly does not, a pattern documented in Salesforce Einstein reviews.
The email silently drops out of the record. You do not notice until a QBR, when the customer picture has holes nobody can explain.
🎯 Where this category is going
Here is the number that should shape your evaluation. 87% of enterprises missed 2025 revenue targets despite record AI investment. Spend was not the constraint.
Revenue orchestration is already old. What I think replaces it is revenue engineering: you stop coordinating humans around dashboards and start designing systems that produce the outcome. The distinction is simple. A vending machine gives fixed output for fixed input. An agent takes a goal and pursues it, which is the whole argument behind the move from RevOps to intelligence to orchestration.
Oliv AI runs agents across pipeline, sales, retention, and upsell for 100+ revenue teams, and reviewers describe CRM records updating automatically after every call. What I am still sitting with is whether managers will trust an agent's forecast before they trust their own spreadsheet, or only after a quarter of being right. If you have run that experiment on your own team, I would genuinely like to hear which way it went.
Q1. What are the 10 best revenue reporting software tools for revenue teams in 2026? [toc=1. Best Tools Compared]
The best revenue reporting software in 2026 splits into tools you read and tools that act. Oliv AI leads for agentic reporting, where an Analyst agent answers plain-English revenue questions and a one-page brief lands in your inbox Monday. Clari and Terret lead forecast dashboards, Anaplan for finance modeling, Gong for conversation data, Salesforce for native CRM reporting.
📊 The Thursday problem nobody puts on a slide
Every Thursday and Friday, managers sit with reps for one to two hours each. They reconstruct what moved, what slipped, and what to commit. Then they hand-build the report they present Monday.
That is not reporting. That is manual data archaeology with a chart on top. I have watched RevOps leads spend more time assembling the forecast than acting on it.
🧩 Read-versus-act: the only split that matters now
Most tools on this list are excellent at the read layer. They collect data, calculate metrics, and render dashboards. Then they stop and hand the work back to you.
The act layer is different. An agent reads the same data, writes the summary, updates the CRM field, and flags the deal without being asked. Oliv AI operates in that act layer, with agents like Analyst, Deal Driver, and CRM Manager running across the revenue orchestration workflow.
The three-layer cake I use to evaluate any reporting tool:
Layer 1, baseline data collection. Recording, transcription, and activity capture. This should be close to free in 2026.
Layer 2, intelligence. Language models tracking qualification fields like MEDDIC and MEDDPICC or BANT against real conversations.
Layer 3, agent. Proactive one-pagers pushed to leadership, plus writeback to the system of record.
Most platforms here stop cleanly at layer two. That is the whole story of this category.
The 10 best revenue reporting software tools in 2026
Oliv AI, best for agentic reporting and automated executive summaries
Anaplan, best for finance-grade revenue modeling and scenario planning
Aviso, best for AI forecast scoring in enterprise sales orgs
Clari, best for pipeline inspection and forecast roll-ups
Forecastio, best for HubSpot-native sales performance reporting
Gong, best for conversation data and Revenue Analytics dashboards
InsightSquared, best for prebuilt sales analytics report libraries
People.ai, best for activity capture and account-relationship data
Revenue Grid, best for guided-selling signals and Salesforce sync
Salesforce, best for native CRM reports when you already own the license
Salesloft, best for engagement and cadence analytics
Terret (formerly BoostUp), best for configurable revenue-command dashboards
Master comparison table
Revenue Reporting Software Compared Across Four Artifacts (2026)
Tool
Dashboards
Custom reports
Attribution views
Executive summaries
CRM writeback
Pricing signal
Rating
Oliv AI
✅ Agent-generated
✅ Spreadsheet-like analysis
✅ Deal-to-source context
✅ Automated one-pagers
✅ Auto-updates after every call
From $19/user/month
⭐⭐⭐⭐⭐
Anaplan
✅ Highly configurable
✅ Model-driven
⚠️ Planning-led, not funnel-led
⚠️ Manual build
❌ Not a CRM sync tool
Enterprise licensing, cited as expensive
⭐⭐⭐
Aviso
✅ Forecast views
⚠️ Exports lose filters
⚠️ Limited
⚠️ Manual
⚠️ SFDC sync issues reported
Enterprise, quote-based
⭐⭐
Clari
✅ Strong out-of-box
❌ "No custom reporting"
⚠️ Limited
⚠️ Manual
❌ "CRM writeback is not good"
Enterprise, quote-based
⭐⭐⭐
Forecastio
✅ HubSpot-native
✅ Sales performance reports
⚠️ Pipeline-source level
⚠️ Partial
✅ HubSpot-native
SMB-friendly tiers
⭐⭐⭐
Gong
✅ Revenue Analytics
✅ Data Studio metrics
⚠️ Conversation-weighted
✅ AI briefs
⚠️ Export limits reported
Enterprise, seat pricing visible in admin
⭐⭐⭐⭐
InsightSquared
✅ Prebuilt library
✅ Report builder
⚠️ Limited
⚠️ Manual
⚠️ Sync-dependent
Mid-market tiers
⭐⭐⭐
People.ai
✅ Activity dashboards
✅ Account reports
✅ Contact-to-opportunity mapping
⚠️ Partial
✅ Activity writeback
Enterprise, quote-based
⭐⭐⭐
Revenue Grid
✅ Signal dashboards
✅ Configurable
⚠️ Limited
⚠️ Partial
✅ Salesforce sync
Mid-market tiers
⭐⭐⭐
Salesforce
✅ Native reports
✅ Report builder
⚠️ Needs add-ons
❌ Manual
✅ Native
Per-seat, plus agent action credits
⭐⭐⭐
Salesloft
✅ Cadence analytics
⚠️ Faulty metrics reported
❌ Engagement-only
❌ Manual
⚠️ Connectivity issues reported
Per-seat tiers
⭐⭐
Terret (BoostUp)
✅ Command-center views
✅ Configurable
⚠️ Partial
⚠️ Partial
✅ CRM sync
Enterprise, quote-based
⭐⭐⭐
Ratings follow the weighted rubric in the next section. They are not popularity scores.
1.1 Oliv AI [toc=1.1 Oliv AI]
Oliv's orchestration diagram shows Oliver updating playbooks and syncing agents like Forecaster, Pipeline Tracker, and Analyst, keeping process changes reflected across every downstream report and revenue dashboard.
Oliv AI is an AI-native revenue intelligence platform where reporting is produced by agents rather than assembled by people. Founded in 2023 in San Francisco and backed by a $5M Foundation Capital seed, it now serves 100+ revenue teams.
⚙️ What it actually does
The reporting stack runs on named agents. The Analyst agent answers ad-hoc revenue questions on demand. The Deal Driver agent watches every open deal and flags risk. The CRM Manager agent writes fields back after each call.
Underneath sits the Context Graph, an intelligence layer that combines CRM object association with 100+ revenue-specific language models and a Process Graph encoding how your company sells.
🔑 Key features for reporting
Automated executive summaries. One-page briefs delivered without a manual roll-up, which is the Monday artifact managers currently hand-build.
Spreadsheet-like analysis. RevOps teams can query and slice revenue data directly, instead of writing custom code against a reporting API.
Custom methodology fields. Reviewers report filling out custom frameworks like MEDIC-BAND automatically from call content.
Forecast agent. Prepares weekly and monthly forecasts rather than waiting for a human to compile them, which is the core of any AI sales forecasting software evaluation.
CRM writeback. Automatic post-call updates to Salesforce, HubSpot, and Zoho, across 70+ integrations.
💰 Pricing and implementation
Pricing starts at $19 per user per month for the notetaker entry tier, with agents added one at a time rather than bought as a suite on day one. That matters if your budget is already committed elsewhere.
Setup is fast in practice. One reviewer describes a five-to-fifteen-minute configuration. Another describes forward-deployed engineers finishing a full rollout in under a week.
✅ Pros and ❌ cons
✅ Reporting is generated and acted on, not just displayed
✅ Automatic CRM updates after every call, verified in multiple G2 reviews
✅ Entry pricing at $19/user/month with modular agent expansion
✅ Fast deployment, reported in days rather than quarters
❌ Dashboard and analytics customization is the most common request in Oliv's own reviews
❌ Reviewers report occasional slowness and a basic mobile app
❌ Not the right fit for pure call-recording use cases or teams unwilling to let agents act
🗣️ Real user feedback
"The Analyst agent allows me to understand everything I need with just one click, eliminating the long wait time I used to have with RevOps to get answers. The Driver agent watches all my deals and flags any that are at risk, so I don't have to spend hours listening to recordings in tools like Gong and Clari." Verified User, 17 Jun 2026Oliv AI G2 Verified Review
"I'd love to see few more options to customize dashboards and reports for different teams." Verified User, 26 Jun 2026Oliv AI G2 Verified Review
"The main downside is that the analytics could be more customizable. It's a minor issue, but having more flexibility in how I view and configure analytics would make it even better." Verified User, 8 Jul 2026Oliv AI G2 Verified Review
I want to be honest about that second and third quote. The dashboard-customization gap is real, and it is the predictable trade-off of an agent-first design. Oliv AI's bet is that a delivered one-pager beats a configurable chart nobody opens, though I might be weighting that preference more heavily than a BI-minded RevOps lead would.
🎯 Best use case
A 25-to-200-rep mid-market B2B team where managers still hand-build the Monday forecast, and where CRM hygiene is the root cause of bad reporting.
Oliv AI's reporting layer is an agent, not a dashboard: the Analyst agent answers ad-hoc revenue questions and the forecast agent ships weekly and monthly roll-ups without a manual scrub.
1.2 Anaplan [toc=1.2 Anaplan]
Anaplan's GTM planning dashboard models customer tiers, bookings targets, and renewal assumptions, connecting sales and finance data into unified revenue reporting for defensible, AI-driven forecasts and executive summaries.
Anaplan is a connected-planning platform used for finance-grade revenue modeling, scenario analysis, and variance reporting. It is the right pick when your reporting question is "what happens to revenue if we change three assumptions," not "which deal is at risk."
🧮 What it actually does
Anaplan builds multidimensional models where a single variable change updates the entire dataset and every dashboard built on it. Reviewers use it for forecasting, sales projections, resource planning, and aging reports.
Its scope has widened beyond finance into sales, supply chain, retail, and workforce planning. Financial Close and Consolidation solutions were added recently, plus prebuilt applications that reviewers say cut implementation by two to three weeks.
🔑 Key features for reporting
Variable-driven dashboards. Update one risk factor and the full dataset and visual layer recalculate together.
Dynamic scenario and variance analysis. Run in-app, without exporting to a separate BI tool.
Low-code model building. Business users can maintain models after the initial implementation.
Prebuilt planning applications. Shorten deployment for standard finance use cases.
📅 Anaplan reporting capability, then and now
Anaplan Product Update Timeline for Revenue Reporting
Period
What was in the product
Through 2025
Connected planning across finance, sales, supply chain, retail, and workforce, with dashboard reporting, scenario and variance analysis, and low-code model building maintained by business users, per verified G2 reviewer detail
Late 2025 into 2026
Financial Close and Consolidation solutions added, prebuilt applications reducing implementation by two to three weeks, and improved third-party integration via ADO for faster multi-source data pulls, per verified G2 reviewer detail
Expected next
Reviewers point to continued expansion of AI and generative features, currently described as costly with narrow use cases, alongside pressure to improve large-dataset performance and Excel-based ad-hoc analysis, per verified G2 reviewer detail
💰 Pricing and implementation
Anaplan uses enterprise licensing without public list pricing. Reviewers consistently flag the cost, describing an expensive licensing model where scalability "comes at a significant expense".
Implementation is a project, not a setup. Prebuilt apps help, but expect a modeling exercise with a partner or an internal Anaplan-certified builder.
✅ Pros and ❌ cons
✅ Best-in-class scenario modeling and variance analysis for revenue planning
✅ One variable change cascades through the full dataset and dashboards
✅ Low-code maintenance after go-live, plus responsive support
❌ Limited API makes real-time syncing to warehouses like Snowflake difficult, so reviewers schedule batch syncs instead
❌ Performance degrades on large datasets, and licensing is repeatedly called expensive
❌ Ad-hoc Excel analysis is weaker than rival EPM tools, forcing work back into the application
❌ Role-based access described as inflexible, pushing teams to over-assign admin roles
🗣️ Real user feedback
"Anaplan does not integrate seamlessly with third party platforms given its limited API. Therefore, it is difficult to sync data between Anaplan and our Snowflake data warehouse in real-time." Verified User, 3 Jun 2025Anaplan G2 Verified Review
"I think role-based access could use an improvement. It wasn't very flexible at the time I was using it. Everyone used to have access to the same dataset." Verified User, 14 Jan 2026Anaplan G2 Verified Review
"Anaplan has consistently faced challenges due to its expensive licensing model and performance limitations when handling large datasets. The basic AI and Gen AI features are not only costly but also have a very limited user base." Verified User, 9 Nov 2025Anaplan G2 Verified Review
🎯 Best use case
A finance-led revenue reporting mandate at enterprise scale, where modeling depth matters more than deal-level action, and where a dedicated planning team already exists.
Oliv AI takes the opposite position on the same problem: instead of modeling revenue in a planning layer, its agents work inside the CRM your reps already use, so the reported number and the recorded number stay the same.
1.3 Aviso [toc=1.3 Aviso]
Aviso's revenue cycle view layers forecast, pipeline, and rep activity snapshots with account engagement trends, showing how revenue reporting software turns scattered deal data into faster decisions.
Aviso is an AI forecasting platform used mainly by enterprise sales orgs that want a predicted number alongside the rep-submitted one. On reporting specifically, it is the weakest performer in this list based on verified reviews.
🔍 What it actually does
Aviso ingests CRM data and produces AI forecast scores, segment roll-ups, and rep-level views. Managers filter by owner name to prep one-on-ones and forecast calls.
The core promise is a second opinion on the forecast. The reporting layer around it is where reviewers report friction.
🔑 Key features for reporting
Left-hand group filters. Filter by owner or segment to isolate one rep before a forecast call.
AI forecast scoring. A predicted number sits next to the submitted number.
Segment roll-ups. Views by team, region, or hierarchy.
SFDC sync. Data flows from Salesforce, though reviewers report reliability gaps.
💰 Pricing and implementation
Aviso sells enterprise contracts with quote-based pricing. No public list price exists.
Implementation depends heavily on internal enablement. One reviewer describes adoption with "no internal support or training provided," which is a rollout problem as much as a product one.
✅ Pros and ❌ cons
✅ Owner-level filtering makes one-on-one prep straightforward
✅ AI-generated forecast scores give managers a challenge number
❌ Exporting data "loses all customisations and filters," which breaks custom reporting workflows
❌ Reviewers report slow performance when switching between segments
❌ SFDC sync failures and update lag reported, forcing Excel workarounds
❌ Analytics described as ineffective by multiple reviewers
🗣️ Real user feedback
"Extremely slow performance, especially when switching between segments. Exporting data loses all customisations and filters. Analytics are ineffective and add no real value." Verified User, 24 Jun 2025Aviso G2 Verified Review
"The solution is slow, often times it doesn't sync with SFDC, the reports are terrible and don't represent what is being pulled by the data." Verified User, 18 Feb 2025Aviso G2 Verified Review
"I like being able to filter by group on the left-hand side. I often filter by the owner name so that I can easily zero in on one individual when I'm doing a one-on-one or through my forecast call." Verified User, 8 Dec 2025Aviso G2 Verified Review
That export complaint is the one I would test in a demo. A report that loses its filters on export is not a report. It is a screenshot with extra steps.
🎯 Best use case
A large enterprise that already mandates a second forecast opinion and has an internal enablement team ready to support the rollout.
Oliv AI approaches the same forecast-call problem differently: its forecast agent prepares the weekly and monthly roll-up before the call, so managers review a number rather than rebuild one.
1.4 Clari [toc=1.4 Clari]
Clari's Revenue Context page pairs a seller with AI prompts for quarterly predictions, coaching, and daily focus, illustrating agent-generated insights that feed executive revenue reporting and analytics views.
Clari is the category-defining pipeline inspection and forecast platform. It is pre-generative AI in architecture, built to show you the pipeline rather than act on it, and its feature set reflects that origin.
📈 What it actually does
Clari pulls Salesforce data into forecast views, inspection views, and waterfall analysis. Reviewers use it instead of native Salesforce forecasting because the roll-up happens automatically.
It has since expanded into cadences, dialing, and conversation intelligence. Reviewers say the newer layers are less mature than the forecasting core.
🔑 Key features for reporting
Out-of-the-box dashboards. Strong prebuilt analytics with minimal configuration.
Weekly forecast and opportunity analysis. Week-over-week drill-down into individual deals.
Flow View and Waterfall View. Pipeline movement analysis, though reviewers report both underperforming.
Inspection View presets. Standardizing the display still takes extra work.
Email engagement tracking. Open and receipt signals feed deal-strength reads.
💰 Pricing and implementation
Clari uses enterprise quote-based pricing with no public list rate. For a 25-to-200-rep team, stacking Clari with Gong and Salesloft is how total cost quietly clears $500 per user per month, which is why the Clari alternatives conversation keeps coming up.
✅ Forecasting is simple, fast, and well integrated with Salesforce
✅ Out-of-the-box dashboards and cadence analytics are genuinely robust
✅ Smooth implementation reported repeatedly
❌ "There's no custom reporting," per a July 2026 reviewer
❌ CRM writeback described as "not good," with MEDDIC values unable to return to Salesforce
❌ AI features called immature, with weak integration to non-Salesforce systems
❌ Connection drops with Salesforce, Gmail, and calendar require app restarts
🗣️ Real user feedback
"There's no custom reporting. The CRM writeback is not good; we cannot send MEDDIC values back to Salesforce or update fields in Salesforce from the conversation intelligence. The AI is not as flexible as we need it to be." Verified User, 13 Jul 2026Clari G2 Verified Review
"The AI features are immature, team activity is poorly designed, and it doesn't integrate well with other popular business systems today." Verified User, 10 Oct 2025Clari G2 Verified Review
"I'm concerned that the advanced 'Flow View' and 'Waterfall View' aren't working well. I also find it inconvenient that it still takes extra work to get the 'Inspection View' display standardized using presets." Verified User, 16 Nov 2025Clari G2 Verified Review
Read that first quote again. Two of the four artifacts this article is about, custom reports and writeback, are named as gaps by a paying user.
🎯 Best use case
A Salesforce-standardized enterprise where forecast roll-up speed matters more than custom reporting or field-level writeback.
Oliv AI closes exactly the loop Clari reviewers flag: its CRM Manager agent writes methodology fields, including custom frameworks like MEDIC-BAND, back into Salesforce and HubSpot after each call.
1.5 Forecastio [toc=1.5 Forecastio]
Forecastio is a HubSpot-native sales performance and forecasting tool built for smaller revenue teams. It is the pragmatic pick when Clari and Anaplan are overbuilt for your headcount.
🧭 What it actually does
Forecastio sits directly on HubSpot data and produces forecasts, performance reports, and goal tracking. There is no separate data pipeline to maintain.
It targets sales leaders at 10-to-100-rep companies who need reporting rigor without a RevOps hire.
🔑 Key features for reporting
HubSpot-native sync. No middleware, no warehouse dependency.
Sales performance reporting. Conversion, velocity, and win-rate views by rep and stage.
Goal and quota tracking. Attainment views tied to plan.
Scenario-light forecasting. Simpler than a planning platform, faster to configure.
💰 Pricing and implementation
Forecastio publishes SMB-friendly tiers well below enterprise revenue platforms. Deployment is measured in hours because the CRM is the data source.
✅ Pros and ❌ cons
✅ Native HubSpot data model, so numbers match the CRM
✅ Affordable relative to enterprise revenue platforms
✅ Fast to deploy without a RevOps team
❌ HubSpot-only, so Salesforce shops are excluded
❌ No conversation data, so pipeline reads stay CRM-dependent
❌ Reporting depth is thinner than dedicated analytics platforms
🎯 Best use case
A HubSpot-based team under 100 reps that needs credible forecast reporting and cannot justify enterprise licensing.
Oliv AI serves the same HubSpot-first buyer at a similar entry point, starting at $19 per user per month, with agents added one at a time rather than as a suite.
1.6 Gong [toc=1.6 Gong]
Gong is the conversation-intelligence platform that became a Revenue AI Operating System. It has the deepest data set on this list and, per reviewers, the tightest grip on it, which is why buyers keep researching Gong alternatives.
🎙️ What it actually does
Gong records, transcribes, and analyzes calls, then layers dashboards, forecast boards, and AI briefs on top. Founded in 2015, its conversation-intelligence core is still the center of the product.
Reporting arrived properly in October 2024 with Revenue Analytics, described as "robust, configurable, and dynamic dashboards."
Configurable forecast boards. Spreadsheet-like boards covering new business, renewals, upsells, and net revenue, shipped November 2025.
AI briefs. Customizable summaries at homepage, deal, account, and call level, shipped May 2025.
Data Extractor. Extracts AI fields from conversations and maps them to CRM, shipped December 2025.
Data Studio metrics. Metrics built on related object fields, added May 2026.
📅 Gong reporting capability, then and now
Gong Reporting Product Updates, 2025 to 2026
Period
What shipped
Through 2025
Revenue Analytics dashboards on custom metrics, AI briefs across deal, account, and call surfaces, Agent Studio for managing AI agents, and configurable spreadsheet-like forecast boards covering renewals and net revenue
Feb to May 2026
Mission Andromeda launched Gong Enable with conversational guidance and unified account management on 25 Feb 2026, followed by Snowflake multi-instance connectivity and Data Studio metrics built from related object fields
Expected next
Bidirectional Model Context Protocol support so the AI Briefer pulls third-party data into briefs and external AI platforms query Gong, plus brief generation via API across calls, contacts, accounts, and deals
💰 Pricing and implementation
Gong does not publish list pricing. Per-seat pricing became visible inside the admin center for eligible direct-purchase accounts in June 2025, and Gong Enable is a separate paid module, which complicates any Gong pricing comparison.
Reviewers describe setup friction, particularly around AI tracker configuration and real-time integrations.
✅ Pros and ❌ cons
✅ Deepest conversation data set, with strong AI theme detection across departments
✅ Genuinely configurable dashboards and forecast boards since late 2025
✅ Active shipping cadence, with monthly release notes and ARR past $500M as of May 2026
❌ "Limitations of getting data back into salesforce," per a May 2026 reviewer
❌ Full data download gated behind a plan upgrade, with snippets copied one by one
❌ AI tracker setup UI described as difficult
❌ Data is lost when you stop paying, per a March 2026 reviewer
🗣️ Real user feedback
"limitations of getting data back into salesforce" Verified User, 21 May 2026Gong G2 Verified Review
"I cannot download all the data myself unless we upgrade the plan, which isn't ideal and results in me not fully utilizing Gong. The requirement to download snippets one by one using copy and paste is particularly annoying." Verified User, 3 Oct 2025Gong G2 Verified Review
"The fact that you can't edit a recording (to only share a portion with a client), and the fact that if you stop working with the tool you lose the data." Verified User, 19 Mar 2026Gong G2 Verified Review
Oliv AI's read here goes against the usual Gong critique. The problem is not the analysis quality, which is strong. It is that RevOps teams write custom code to extract data for their own analysis, when what they need is a spreadsheet-like surface. I could be over-indexing on the teams that came to us specifically for that reason.
🎯 Best use case
An enterprise where conversation data is the strategic asset and a dedicated analytics team can work around export limits.
Oliv AI takes the opposite stance on data portability: its agents push structured deal data back into Salesforce, HubSpot, and Zoho as the default output, not as an upgrade tier.
1.7 InsightSquared [toc=1.7 InsightSquared]
InsightSquared is a sales analytics platform known for a large prebuilt report library. It is the right pick when you want reports that already exist rather than reports you have to build.
📚 What it actually does
InsightSquared connects to the CRM and delivers hundreds of prebuilt reports covering pipeline, activity, conversion, and forecast. A report builder handles the rest.
It grew up in the pre-generative-AI era, so the model is dashboard-and-drill-down rather than agent-and-action.
🔑 Key features for reporting
Prebuilt report library. Wide coverage without building from scratch.
Custom report builder. For metrics outside the standard set.
Activity and pipeline analytics. Rep-level and team-level views.
Forecast roll-ups. Submitted versus predicted comparisons.
💰 Pricing and implementation
Mid-market tiers, quote-based. Implementation depends on CRM data quality, which is the recurring theme across every tool in this category.
✅ Pros and ❌ cons
✅ Large prebuilt library shortens time to first report
❌ No conversation data, so reporting inherits CRM hygiene problems
❌ Attribution views are limited
❌ Executive summaries remain a manual build
🎯 Best use case
A mid-market sales org with clean CRM data that wants breadth of standard reporting fast.
Oliv AI attacks the upstream cause instead: its CRM Manager agent updates fields automatically after calls, so the reports built on top inherit accurate data.
1.8 People.ai [toc=1.8 People.ai]
People.ai is an activity-capture and account-intelligence platform. It answers "who did we actually talk to" better than anything else on this list.
🕸️ What it actually does
People.ai captures emails, meetings, and contacts, then maps them to accounts and opportunities. That relationship graph feeds coverage reports and engagement analysis.
For attribution work, this contact-to-opportunity mapping is genuinely useful. Most reporting tools cannot answer it at all.
🔑 Key features for reporting
Automated activity capture. Emails and meetings logged without rep effort.
Contact-to-opportunity mapping. Buying-group coverage per deal.
Account engagement dashboards. Multi-threading depth by account.
CRM activity writeback. Captured activity flows into the system of record.
💰 Pricing and implementation
Enterprise, quote-based. Deployment involves email and calendar permissioning, which is a security review, not a config change.
✅ Pros and ❌ cons
✅ Best-in-class activity capture and relationship mapping
✅ Contact-level attribution most reporting tools cannot produce
✅ Writes activity back to CRM automatically
❌ Not a forecast or executive-summary tool
❌ Value depends on broad email and calendar access approval
❌ Reporting is engagement-led, not revenue-recognition-led
🗣️ A note on activity capture
Activity capture tools break in a specific way I have watched repeatedly. Emails get flagged as sensitive and excluded, so the customer picture has holes nobody notices until a QBR.
An enterprise running multi-threaded deals where buying-group coverage is a reported metric.
Oliv AI treats activity capture as an input rather than the product: its Context Graph associates activity to the correct CRM object before agents act on it.
1.9 Revenue Grid [toc=1.9 Revenue Grid]
Revenue Grid is a guided-selling and Salesforce sync platform with signal-based dashboards. It targets teams that want nudges alongside numbers.
🚦 What it actually does
Revenue Grid monitors pipeline and generates signals when deals stall or steps get skipped. Reporting sits on top of that signal layer.
It is closer to the act layer than Clari or InsightSquared, though the actions are alerts rather than completed work.
🔑 Key features for reporting
Signal dashboards. Alerts on stalled deals and missed steps.
Configurable reports. Pipeline and activity views by team.
Mid-market tiers, quote-based, with a Salesforce-centric deployment.
✅ Pros and ❌ cons
✅ Signal engine surfaces risk without manual inspection
✅ Reliable Salesforce bidirectional sync
✅ Mid-market pricing
❌ Signals still hand the work back to a human to complete
❌ Attribution views limited
❌ Smaller review base than Clari or Gong, so evidence is thinner
🎯 Best use case
A Salesforce-based mid-market team that wants guided-selling nudges plus reporting in one contract.
Oliv AI's distinction here is narrow but real: instead of alerting a rep to update a field, its Deal Driver agent flags the risk and the CRM Manager agent completes the update.
1.10 Salesforce [toc=1.10 Salesforce]
Salesforce is the default revenue reporting tool for most companies because it is already paid for. Native reports and dashboards handle more than teams assume.
🏛️ What it actually does
Salesforce reports and dashboards run directly on your opportunity data. Report types, filters, and joined reports cover a wide range of revenue questions without any third-party tool.
Where it struggles is anything requiring conversation context, narrative summaries, or data your reps never entered.
🔑 Key features for reporting
Native report builder. Custom report types, filters, and joined reports.
Dashboards. Component-level charts on live opportunity data.
Forecasting module. Native roll-ups by hierarchy.
Einstein activity capture. Automated email and meeting logging, with known exclusion behavior.
Agentforce. Action-credit-priced agents layered on the platform, covered in detail in this Agentforce pricing breakdown.
💰 Pricing and implementation
Per-seat licensing you already pay, plus consumption pricing for agent actions. Action-credit models make monthly spend hard to predict as usage scales.
Implementation is admin work, not procurement. That is the real advantage.
✅ Pros and ❌ cons
✅ Zero incremental license cost for core reporting
✅ Native writeback because it is the system of record
✅ Deep customization through report types and formula fields
❌ Reports are only as good as what reps manually enter
❌ Executive summaries are entirely manual
❌ Activity capture exclusion rules create silent data gaps
❌ Agent action credits make spend unpredictable at volume
🎯 Best use case
Any team with disciplined CRM hygiene and a competent admin. Start here before buying anything, and buy only where Salesforce genuinely cannot answer the question.
Oliv AI is built on that premise: it plugs into Salesforce, HubSpot, and Zoho to make them accurate rather than asking teams to report somewhere else.
1.11 Salesloft [toc=1.11 Salesloft]
Salesloft is an engagement platform with cadence and activity analytics. On revenue reporting, it is the narrowest tool here, and reviewer sentiment on data reliability is poor.
📬 What it actually does
Salesloft sequences outreach and reports on engagement: opens, replies, calls, and cadence performance. Managers use it for top-of-funnel observability.
It reports activity, not revenue. That distinction matters when it appears on revenue reporting shortlists, and it shapes any Gong versus Salesloft evaluation.
🔑 Key features for reporting
Cadence analytics. Step-level performance across sequences.
Activity and dialer metrics. Call and email volume by rep.
Engagement tracking. Opens and replies, with reported accuracy issues.
CRM sync. Salesforce connectivity, with reported reliability gaps.
💰 Pricing and implementation
Per-seat tiers. Reviewers repeatedly describe difficult initial setup and a steep learning curve.
✅ Pros and ❌ cons
✅ Brings structure to high-volume outreach and follow-up
✅ Cadences and templates centralized in one place
❌ "Analytics/metrics are faulty like email opens," per a March 2025 reviewer
❌ Data connectivity issues between CRM, Sales Navigator, and the app
❌ Meeting logging problems reported, which corrupts activity reporting
❌ No conditional-logic automation, per a September 2025 reviewer
🗣️ Real user feedback
"Analytics/metrics are faulty like email opens... A handful of features don't work properly (inbound calls, task reminders, data connectivity between apps (CRM, Sales Nav)." Verified User, 26 Mar 2025Salesloft G2 Verified Review
"I often have trouble logging meetings, and certain features feel clunky or overly manual. The learning curve can be frustrating, especially when you're trying to move quickly in a fast-paced environment." Verified User, 22 Jul 2025Salesloft G2 Verified Review
"For months, randomly, one-off emails sent from Salesloft (not sequences) would appear blank in the recipient's mailbox... No automations based on conditional logic." Verified User, 24 Sep 2025Salesloft G2 Verified Review
If engagement metrics are unreliable at the source, every downstream report inherits the error. That is worth more scrutiny than any dashboard feature.
🎯 Best use case
An outbound-heavy team that needs cadence execution, with revenue reporting handled elsewhere.
Oliv AI is not an engagement platform, and pairing it with a sequencer is a reasonable stack. The difference is that Oliv's agents complete post-call work rather than reporting that it did not happen.
1.12 Terret (formerly BoostUp) [toc=1.12 Terret]
Terret, previously BoostUp, is a revenue command-center platform competing directly with Clari on configurable dashboards and forecast rigor.
🎛️ What it actually does
Terret unifies CRM, activity, and conversation data into configurable revenue views. The pitch is flexibility, positioned against Clari's more fixed structure.
For teams that hit Clari's custom-reporting wall, Terret is the usual next evaluation alongside other revenue orchestration platforms.
🔑 Key features for reporting
Configurable command-center dashboards. Built around your metric definitions.
Forecast submission and roll-up. Multi-level hierarchy support.
Conversation and activity signals. Feeding deal-health views.
CRM sync. Bidirectional with Salesforce.
💰 Pricing and implementation
Enterprise, quote-based. Implementation is a configuration project because flexibility is the product.
✅ Pros and ❌ cons
✅ More configurable reporting than Clari's out-of-the-box structure
✅ Multi-stream forecasting including renewals
✅ CRM sync in both directions
❌ Configuration effort is the cost of that flexibility
❌ Attribution views remain partial
❌ Smaller review base than Clari or Gong, so buyer evidence is thinner
❌ Executive summaries still require assembly
🎯 Best use case
An enterprise RevOps team with the capacity to configure its own metric definitions and a specific complaint about a rigid incumbent.
Oliv AI's read is that configurability is the wrong axis for most mid-market teams. We see managers who do not want a better report builder. They want the Monday one-pager already written, which is what the forecast agent delivers.
Which profile picks which tool
Buyer Profile to Tool Match for Revenue Reporting
Your situation
Start with
Managers hand-build the Monday forecast
Oliv AI, agent-generated briefs plus CRM writeback
Finance owns revenue modeling at enterprise scale
Anaplan, despite licensing cost
Salesforce-standardized, forecast speed over custom reports
Clari
Conversation data is the strategic asset
Gong
HubSpot shop under 100 reps
Forecastio
Buying-group coverage is a reported metric
People.ai
CRM hygiene is already strong and budget is zero
Salesforce native reports
Oliv AI sits at position one for a narrow reason worth stating plainly: across this list, reviewers name custom reporting and CRM writeback as the two most common gaps, and Oliv's agents are built to close both.
Q2. How did we score and select these revenue reporting tools? [toc=2. Scoring Methodology]
Every tool was scored out of 100 across five criteria: Reporting Depth and Custom Report Flexibility (25%), Agentic Action versus Dashboard-Only (25%), Attribution and Cross-Functional Data Coverage (20%), Setup and Time-to-First-Report (15%), and Pricing Transparency (15%). Scores of 0 to 20 earn one star, 21 to 40 two, 41 to 60 three, 61 to 80 four, and 81 to 100 five.
⭐ Why these five weights, and not popularity
Reporting depth and agentic action carry equal top weight for one reason. A tool that shows you a number and a tool that writes the report are doing different jobs at different costs.
Attribution sits at 20% because it is the rarest capability in this category. Setup time and pricing transparency split the last 30%, since both decide whether the tool actually gets used.
🔬 How each criterion was evidenced
Three evidence types only. Verified G2 reviews from the last 24 months, vendor documentation and release notes, and hands-on setup timing.
No vendor marketing claims were scored. When a vendor said "robust reporting" and a reviewer said "there's no custom reporting," the reviewer won. G2's Revenue Operations and Intelligence category, built on thousands of verified reviews, was the base pool for this survey of revenue intelligence software platforms.
⚖️ How to re-weight this for your own context
The weights above assume a mid-market B2B SaaS buyer. Shift them if your situation differs.
Under 50 reps: raise Setup and Pricing Transparency to 40% combined, and drop Attribution to 10%.
Complex revenue model (usage-based, multi-entity): raise Reporting Depth to 35%.
Real ASC 606 exposure: add a pass/fail compliance gate before scoring anything.
Enterprise with a RevOps team: raise Attribution, since you have the people to use it.
📉 The metric trap that skews most rubrics
Activity metrics with no link to deal advancement are hollow. Call counts and email volume look like reporting, but they predict nothing.
I score any tool down when its headline dashboard is activity volume. Glorified scorekeepers make poor forecasters, and that is true of software as much as managers.
🧮 The 10/80/10 test applied to tools
Oliv AI's evaluation frame is the 10/80/10 rule: you spend 10% defining the reporting outcome, the tool does 80% of the lifting, and you spend 10% on a quality check. Any platform demanding 80% human effort loses points, no matter how good the charts look.
⭐ Final scores across all twelve tools
Revenue Reporting Software Scores Out of 100 (2026)
Tool
Score
Stars
Where it lost points
Oliv AI
88
⭐⭐⭐⭐⭐
Dashboard customization, flagged in its own reviews
Gong
74
⭐⭐⭐⭐
Export gating and Salesforce writeback limits
Clari
62
⭐⭐⭐
No custom reporting, weak CRM writeback
Terret (BoostUp)
60
⭐⭐⭐
Configuration effort, thin buyer evidence
Anaplan
58
⭐⭐⭐
Limited API, costly licensing, and large-dataset lag
People.ai
57
⭐⭐⭐
Not a forecast or summary tool
Salesforce
55
⭐⭐⭐
Manual summaries, unpredictable agent credits
Forecastio
54
⭐⭐⭐
HubSpot-only, no conversation data
Revenue Grid
52
⭐⭐⭐
Alerts stop short of completing work
InsightSquared
50
⭐⭐⭐
No conversation layer, limited attribution
Aviso
34
⭐⭐
Exports lose filters, SFDC sync failures
Salesloft
30
⭐⭐
Faulty engagement metrics at the source
🗣️ What reviewers said that moved scores
"There's no custom reporting. The CRM writeback is not good." Verified User, 13 Jul 2026Clari G2 Verified Review
"Additionally, setting up Oliv.ai was straightforward and could be done in just five to fifteen minutes." Verified User, 15 Jun 2026Oliv AI G2 Verified Review
"Extremely slow performance, especially when switching between segments. Exporting data loses all customisations and filters." Verified User, 24 Jun 2025Aviso G2 Verified Review
Oliv AI scores 88 on this rubric: setup timed at 5 to 15 minutes by reviewers, entry pricing at $19 per user per month, and an agent layer that completes work instead of returning it. The 12 points it loses are dashboard customization, and that gap is named by its own users.
Q3. What is revenue reporting software, and which category do you actually need? [toc=3. Definitions and Categories]
Revenue reporting software unifies CRM, billing, and warehouse data to produce dashboards, custom reports, attribution views, and executive summaries. Recognition software governs when revenue may be booked under ASC 606 and IFRS 15. Intelligence software predicts pipeline outcomes. Reporting explains what happened and why, recognition governs what you may book, and intelligence forecasts what comes next.
🧾 Three categories the market keeps confusing
These three get sold as one thing. They are not.
Revenue Reporting vs Recognition vs Intelligence
Dimension
Reporting
Recognition
Intelligence
Core question
What happened, and why
What may we book, and when
What happens next
Owner
RevOps, sales leadership
Finance, controller
Sales leadership, RevOps
Output
Dashboards, reports, summaries
Deferred schedules, audit trail
Forecasts, risk scores
Standard
Internal metric definitions
ASC 606, IFRS 15
Model accuracy
Example tool
Oliv AI, Clari, Gong
ERP revenue modules
Aviso, Clari
💰 One contract, three different answers
Take a $1,200 annual SaaS contract signed in January. Reporting tells you it came from a partner referral and closed in 34 days.
Recognition spreads it as $100 per month across twelve months. Intelligence flags in month nine that usage dropped and renewal is at risk. Same contract, three separate systems, three different jobs.
🗂️ The six categories, and who each fits
CRM-based tracking. Native Salesforce or HubSpot reports. Fits teams with clean data and no budget.
Accounting suite reporting. QuickBooks or Xero reports. Fits companies under $10M with simple revenue.
Subscription billing analytics. Stripe, Chargebee, and Maxio. Fits recurring or usage-based models.
Dedicated revenue automation. Oliv AI, Clari, Gong, and Terret. Fits mid-market and enterprise teams where reporting must drive action, which is the core promise of revenue orchestration platforms.
ERP revenue modules. NetSuite, SAP, and Oracle. Fits multi-entity companies with real compliance exposure.
General BI layer. Tableau, Power BI, and Qlik. Fits teams with a data engineer and a warehouse.
🧪 Two decision tests before you buy
The BI-is-enough test. If you already have a warehouse, a data engineer, and stable metric definitions, a BI tool is enough. Buy a revenue platform only when nobody owns the definitions or the reports arrive too late to act on.
The ERP-sufficiency test. Your ERP is enough when revenue is contract-based and predictable, and finance is the only consumer of the report. Add a dedicated platform when revenue is usage-based or when sales leadership needs attribution and narrative summaries the ERP cannot produce.
⚠️ The compliance gate that ends shortlists early
If you have real ASC 606 or IFRS 15 exposure, this is a pass/fail check, not a scoring criterion. Four requirements, all non-negotiable.
Contract-level deferred revenue schedules, not aggregate journal entries.
Automatic adjustments for upgrades, downgrades, and cancellations mid-term.
Multi-currency and multi-entity consolidation.
An exportable audit trail an external auditor can trace to the source transaction.
🏛️ The dumb-repository problem
Running a revenue org on a system reps update only because management demands it is not reporting. It is compliance theatre with charts attached.
The honest test is simple. If your reps stopped updating the CRM tomorrow, how much of your reporting would survive? For most teams, the answer is almost none, which tells you the reporting tool was never the problem, and it explains why the shift from RevOps to intelligence to orchestration keeps stalling.
Oliv AI operates in the reporting and action layer, plugging into Salesforce, HubSpot, and Zoho rather than replacing them, so recognition stays in finance's system of record. That split matters: agents make the CRM accurate, and the controller keeps control of the ledger.
Q4. Why do dashboards keep failing sales managers on Monday morning? [toc=4. The Dashboard Failure]
Dashboards fail because they shift the analysis onto the manager. Every Thursday and Friday, managers spend one to two hours per rep reconstructing pipeline movement, then hand-build Monday's report. Meanwhile 55% of sales leaders lack high confidence in their forecast. The fix is not another tile. It is a one-page brief that arrives already reasoned.
⏰ What the Thursday scrub actually costs
Picture a manager with eight reps. Thursday and Friday go to one-on-ones, one to two hours each, reconstructing what moved and why.
That is 8 to 16 hours a week spent assembling a number, not improving it. The dashboard did not save that time. It created it, by presenting data that still needs a human to interpret.
🚿 Senior time spent digging, not deciding
The habit I see most is managers listening to call recordings while driving and reading dashboards in odd gaps of the day. They are doing manual data archaeology on their own time, and it is the pattern that pushes teams toward AI for sales calls in the first place.
That is the most expensive labor in the org, spent on the least leveraged task. Nobody puts it on a slide because it does not look like a problem. It looks like diligence.
🔄 The twist: reconciliation, not visualization
Here is where the standard advice gets it backwards. Everyone treats bad reporting as a visualization problem, so they add a tool.
Each added tool makes the stack more brittle, not more resilient. Around a third of finance leaders name revenue recognition and reconciliation as the hardest processes to scale. Board numbers break at the join between systems, not at the chart.
📈 The accuracy ladder is coachable
Forecast accuracy is not a chart feature. It is a ladder you climb with process discipline, and it is the real benchmark for any AI sales forecasting software.
Below 70%: pipeline visibility or stage definitions are broken.
70 to 85%: where most B2B SaaS teams sit today.
90 to 95%: top-performer range, meaning actuals land within 10% of forecast.
96% by week two: the vendor-claimed upper bound, useful as a reference point, not a promise.
Only 41% of sales managers and executives are satisfied with their current dashboards for decision-making. That is not a design complaint. It is a job-allocation complaint.
📄 The design target: one page, already reasoned
The artifact worth building toward is narrow. You sit down Monday morning, and a one-page document is already in your inbox, focused on the top five to ten deals that actually matter.
Not 40 tiles. Not a drill-down path. A brief that has already done the reasoning, with the source numbers traceable underneath.
✅ The tactic to run this week
Before you evaluate a single tool, run this in your next pipeline review. If a rep cannot articulate the exact status of a deal, push it off the forecast.
No debate, no split commit. This one rule surfaces more forecast error in a week than a new dashboard will in a quarter, and it costs nothing. Pair it with a qualification framework like MEDDIC so "exact status" means something specific.
Oliv AI was built against this exact workflow: its forecast agent assembles the weekly and monthly roll-ups, so the Thursday scrub becomes a review instead of a reconstruction. One reviewer reports forecast accuracy up 27% after the switch, which I read as process discipline finally being enforced by software rather than by memory.
Q5. Dashboards, custom reports, attribution views, or executive summaries: which one actually moves revenue? [toc=5. Four Reporting Artifacts]
Treat them as four separate jobs. Dashboards monitor, custom reports investigate, attribution views assign credit, and executive summaries narrate. Most platforms are strong on one and weak on three. Ask each vendor to build a custom report live, then ask who verifies the narrative before leadership reads it. That test separates the shortlist fast.
📊 The four artifacts, and the job each one holds
Every buyer says they want "better reporting." Push on it, and four different requests fall out.
Dashboards answer "is anything off?" You glance at them daily.
Custom reports answer "why is that off?" You build them when something looks wrong.
Attribution views answer "what should we fund next?" They connect source to closed revenue.
Executive summaries answer "what do I tell the board?" They need reasoning, not tiles.
❌ Where the market actually breaks
Across verified G2 reviews from the last 24 months, two gaps repeat more than any others. Custom reporting and CRM writeback.
"There's no custom reporting. The CRM writeback is not good; we cannot send MEDDIC values back to Salesforce or update fields in Salesforce from the conversation intelligence." Verified User, 13 Jul 2026Clari G2 Verified Review
"limitations of getting data back into salesforce" Verified User, 21 May 2026Gong G2 Verified Review
Two different platforms, two different price points, the same structural gap. It is the recurring complaint that drives buyers toward Gong alternatives and rival forecast tools alike.
🔗 Attribution is the near-absent capability
Attribution is the rarest of the four. Most tools stop at pipeline source and never reach recognized revenue.
The reason is a missing join key. You need a single identifier that survives the trip from lead source, through opportunity, into the billing record, and out to recognized revenue. Without it, marketing reports pipeline, finance reports revenue, and the two numbers never reconcile.
🧑⚖️ Executive summaries need a named human verifier
Adoption is not the question anymore. 87% of sales organizations already use some form of AI, and 94% of sales leaders with agents call them critical to meeting business demands.
That makes governance the question. Every AI-written summary that reaches leadership needs one named person who verifies it. Not a policy document, a name.
⭐ Capability grid across the shortlist
Four Reporting Artifacts Compared Across Platforms
Tool
Dashboards
Custom reports
Attribution
Exec summaries
Oliv AI
⭐⭐⭐
⭐⭐⭐⭐
⭐⭐⭐⭐
⭐⭐⭐⭐⭐
Gong
⭐⭐⭐⭐
⭐⭐⭐⭐
⭐⭐⭐
⭐⭐⭐⭐
Clari
⭐⭐⭐⭐
⭐
⭐⭐
⭐⭐
Aviso
⭐⭐
⭐
⭐⭐
⭐⭐
People.ai
⭐⭐⭐
⭐⭐⭐
⭐⭐⭐⭐
⭐⭐
Salesforce
⭐⭐⭐⭐
⭐⭐⭐⭐⭐
⭐⭐⭐
⭐
Salesloft
⭐⭐
⭐⭐
⭐
⭐
Oliv AI covers all four artifacts, though its own G2 reviewers ask for deeper dashboard customization, which is the honest current limit of an agent-first model.
"I'd love to see few more options to customize dashboards and reports for different teams." Verified User, 26 Jun 2026Oliv AI G2 Verified Review
💰 The pricing signal hiding inside the artifact question
Watch how vendors price the investigation layer. Per-seat licensing on an analyst capability financially punishes curiosity, because every extra person who wants to ask a question costs money.
A per-organisation model, priced flat for unlimited users and queries, inverts that. I read that as the clearest tell in the category about whether a vendor wants reporting used or just owned, and it is worth checking against any revenue intelligence software platform on your list.
Oliv AI's Analyst agent answers ad-hoc strategic questions in plain English, returning curated data with interpretive commentary, and reviewers report getting answers in one click instead of queuing with RevOps. One customer's reaction to a report that named three specific rep skill gaps was simply being speechless, which tells me the bar for "reporting" was set very low for a very long time.
Q6. What does revenue reporting software cost, and should you just build it yourself? [toc=6. Cost and Build vs Buy]
Three models compete. Per-seat runs roughly $19 to $500 per user monthly. Per-action credit models charge around $0.10 per agent action, which makes spend unpredictable at scale. Per-organisation pricing, such as $4,999 flat for unlimited users and queries, suits teams where many people ask questions. Build only if reporting is your product.
Oliv AI sits at the bottom of the per-seat range, starting at $19 per user per month, with agents added one at a time rather than as a bundle.
💸 The costs that never appear on the pricing page
Sticker price is maybe 60% of what you actually spend. Four line items get missed.
Implementation. Weeks of RevOps time, even on "easy" tools.
Data integration. Connecting CRM, billing, and warehouse is engineering work.
Consulting for multi-entity setups. Multi-currency configuration is rarely self-serve.
The curiosity tax. Per-seat licensing means fewer people query, so the tool gets used less.
Stack Gong, Clari, and a sequencer for a 25-to-200-rep team, and total cost of ownership clears $500 per user monthly. That is the quiet part of the standard playbook, and it is visible in published Gong pricing tiers once you add the modules.
🔨 The buyer who chose to build, and what broke
I lost a deal to an internal build. Reasonable logic: they already had every call recording, so why pay a vendor?
Three to four months in, they had insights. Real ones, extracted from calls. Then the actual question arrived: how do you relate a call insight to the state of the deal it belongs to? That join, from conversation to opportunity to forecast, was the whole product, and it was the part they had not built.
⚠️ The honest exception
Build when reporting is your product, when you have a data engineer with spare capacity, or when your revenue model is so unusual no vendor matches it.
I say that as someone who builds. Twelve apps shipped on Replit in 150 days, used a million times. Building is not the hard part. Maintaining a data join across four systems while your reps change how they sell is the hard part.
🗣️ What buyers say about cost
"It's more affordable compared to other options we previously used." Verified User, 23 Jun 2026Oliv AI G2 Verified Review
"I cannot download all the data myself unless we upgrade the plan, which isn't ideal and results in me not fully utilizing Gong." Verified User, 3 Oct 2025Gong G2 Verified Review
"Consolidating multiple tools into Oliv has saved us budget and increased our results." Verified User, 8 Jul 2026Oliv AI G2 Verified Review
That Gong quote is a cost problem disguised as a feature gate. Paying for data you cannot fully export is a real line item, and it is one reason consolidation across AI sales tools keeps beating best-of-breed stacking.
Oliv AI's pricing view is that SaaS is now a commodity and should be priced like one: start at $19 per user monthly, audit the workflow, deploy one agent, validate the ROI, then extend. We do it that way because nobody should buy a suite they cannot deploy.
Q7. How do you pressure-test a revenue reporting tool before you sign? [toc=7. Buyer Evaluation Tests]
Run five live tests in one 30-minute demo. Ask the vendor to trace a board number back to its source transaction. Request a custom report built on the call. Ask it to write one field back to your CRM. Ask for the attribution join key. Ask who verifies an AI-written summary before leadership reads it.
⚠️ Why demos fail buyers
In a standard demo, the vendor drives and you watch. You see a polished dataset that was configured for the demo, not for you.
Nothing in that hour tests the thing that will actually hurt you in month four. Take the mouse. Make them build live.
✅ The five tests, with pass criteria
Metric lineage. Pick one number on their dashboard. Ask them to trace it to the source transaction. Pass: they get there in under two minutes, on screen.
Custom report, live. Name a metric you actually use. Pass: it exists before the call ends, no follow-up email.
CRM writeback. Ask them to write one MEDDIC methodology field back to your CRM. Pass: the field updates in your sandbox during the call.
Integration depth. CRM, ERP, Stripe, and warehouse. Pass: named connectors, not "we can build that."
AI verification. Ask who signs off on a generated summary. Pass: a role and a workflow, not a disclaimer.
🔍 Review patterns that predict rollout pain
Read the one-and-two-star reviews before you read the case studies. Four failure signatures repeat.
"Extremely slow performance, especially when switching between segments. Exporting data loses all customisations and filters." Verified User, 24 Jun 2025Aviso G2 Verified Review
"Analytics/metrics are faulty like email opens... A handful of features don't work properly (inbound calls, task reminders, data connectivity between apps (CRM, Sales Nav)." Verified User, 26 Mar 2025Salesloft G2 Verified Review
Broken exports, faulty metrics, sync drops, and missing custom reports. Any one of these turns a signed contract into shelfware, which is why reading verified reviews beats reading case studies.
⏰ The training-time question nobody asks
Ask this directly: how many real meetings before the tool understands our sales methodology? Vague answers mean months of tuning.
Oliv AI needs three meetings to learn a team's methodology, and reviewers report full setup in five to fifteen minutes with an engineer on the call. I would still budget two to four weeks for full customization, because deep configuration is genuinely slower than onboarding, as any implementation timeline comparison shows.
🧪 The activity-capture bug worth reproducing
If you evaluate native CRM activity capture, test the exclusion rules with your real email traffic. Some systems flag an email as containing sensitive information when it plainly does not, a pattern documented in Salesforce Einstein reviews.
The email silently drops out of the record. You do not notice until a QBR, when the customer picture has holes nobody can explain.
🎯 Where this category is going
Here is the number that should shape your evaluation. 87% of enterprises missed 2025 revenue targets despite record AI investment. Spend was not the constraint.
Revenue orchestration is already old. What I think replaces it is revenue engineering: you stop coordinating humans around dashboards and start designing systems that produce the outcome. The distinction is simple. A vending machine gives fixed output for fixed input. An agent takes a goal and pursues it, which is the whole argument behind the move from RevOps to intelligence to orchestration.
Oliv AI runs agents across pipeline, sales, retention, and upsell for 100+ revenue teams, and reviewers describe CRM records updating automatically after every call. What I am still sitting with is whether managers will trust an agent's forecast before they trust their own spreadsheet, or only after a quarter of being right. If you have run that experiment on your own team, I would genuinely like to hear which way it went.
Q1. What are the 10 best revenue reporting software tools for revenue teams in 2026? [toc=1. Best Tools Compared]
The best revenue reporting software in 2026 splits into tools you read and tools that act. Oliv AI leads for agentic reporting, where an Analyst agent answers plain-English revenue questions and a one-page brief lands in your inbox Monday. Clari and Terret lead forecast dashboards, Anaplan for finance modeling, Gong for conversation data, Salesforce for native CRM reporting.
📊 The Thursday problem nobody puts on a slide
Every Thursday and Friday, managers sit with reps for one to two hours each. They reconstruct what moved, what slipped, and what to commit. Then they hand-build the report they present Monday.
That is not reporting. That is manual data archaeology with a chart on top. I have watched RevOps leads spend more time assembling the forecast than acting on it.
🧩 Read-versus-act: the only split that matters now
Most tools on this list are excellent at the read layer. They collect data, calculate metrics, and render dashboards. Then they stop and hand the work back to you.
The act layer is different. An agent reads the same data, writes the summary, updates the CRM field, and flags the deal without being asked. Oliv AI operates in that act layer, with agents like Analyst, Deal Driver, and CRM Manager running across the revenue orchestration workflow.
The three-layer cake I use to evaluate any reporting tool:
Layer 1, baseline data collection. Recording, transcription, and activity capture. This should be close to free in 2026.
Layer 2, intelligence. Language models tracking qualification fields like MEDDIC and MEDDPICC or BANT against real conversations.
Layer 3, agent. Proactive one-pagers pushed to leadership, plus writeback to the system of record.
Most platforms here stop cleanly at layer two. That is the whole story of this category.
The 10 best revenue reporting software tools in 2026
Oliv AI, best for agentic reporting and automated executive summaries
Anaplan, best for finance-grade revenue modeling and scenario planning
Aviso, best for AI forecast scoring in enterprise sales orgs
Clari, best for pipeline inspection and forecast roll-ups
Forecastio, best for HubSpot-native sales performance reporting
Gong, best for conversation data and Revenue Analytics dashboards
InsightSquared, best for prebuilt sales analytics report libraries
People.ai, best for activity capture and account-relationship data
Revenue Grid, best for guided-selling signals and Salesforce sync
Salesforce, best for native CRM reports when you already own the license
Salesloft, best for engagement and cadence analytics
Terret (formerly BoostUp), best for configurable revenue-command dashboards
Master comparison table
Revenue Reporting Software Compared Across Four Artifacts (2026)
Tool
Dashboards
Custom reports
Attribution views
Executive summaries
CRM writeback
Pricing signal
Rating
Oliv AI
✅ Agent-generated
✅ Spreadsheet-like analysis
✅ Deal-to-source context
✅ Automated one-pagers
✅ Auto-updates after every call
From $19/user/month
⭐⭐⭐⭐⭐
Anaplan
✅ Highly configurable
✅ Model-driven
⚠️ Planning-led, not funnel-led
⚠️ Manual build
❌ Not a CRM sync tool
Enterprise licensing, cited as expensive
⭐⭐⭐
Aviso
✅ Forecast views
⚠️ Exports lose filters
⚠️ Limited
⚠️ Manual
⚠️ SFDC sync issues reported
Enterprise, quote-based
⭐⭐
Clari
✅ Strong out-of-box
❌ "No custom reporting"
⚠️ Limited
⚠️ Manual
❌ "CRM writeback is not good"
Enterprise, quote-based
⭐⭐⭐
Forecastio
✅ HubSpot-native
✅ Sales performance reports
⚠️ Pipeline-source level
⚠️ Partial
✅ HubSpot-native
SMB-friendly tiers
⭐⭐⭐
Gong
✅ Revenue Analytics
✅ Data Studio metrics
⚠️ Conversation-weighted
✅ AI briefs
⚠️ Export limits reported
Enterprise, seat pricing visible in admin
⭐⭐⭐⭐
InsightSquared
✅ Prebuilt library
✅ Report builder
⚠️ Limited
⚠️ Manual
⚠️ Sync-dependent
Mid-market tiers
⭐⭐⭐
People.ai
✅ Activity dashboards
✅ Account reports
✅ Contact-to-opportunity mapping
⚠️ Partial
✅ Activity writeback
Enterprise, quote-based
⭐⭐⭐
Revenue Grid
✅ Signal dashboards
✅ Configurable
⚠️ Limited
⚠️ Partial
✅ Salesforce sync
Mid-market tiers
⭐⭐⭐
Salesforce
✅ Native reports
✅ Report builder
⚠️ Needs add-ons
❌ Manual
✅ Native
Per-seat, plus agent action credits
⭐⭐⭐
Salesloft
✅ Cadence analytics
⚠️ Faulty metrics reported
❌ Engagement-only
❌ Manual
⚠️ Connectivity issues reported
Per-seat tiers
⭐⭐
Terret (BoostUp)
✅ Command-center views
✅ Configurable
⚠️ Partial
⚠️ Partial
✅ CRM sync
Enterprise, quote-based
⭐⭐⭐
Ratings follow the weighted rubric in the next section. They are not popularity scores.
1.1 Oliv AI [toc=1.1 Oliv AI]
Oliv's orchestration diagram shows Oliver updating playbooks and syncing agents like Forecaster, Pipeline Tracker, and Analyst, keeping process changes reflected across every downstream report and revenue dashboard.
Oliv AI is an AI-native revenue intelligence platform where reporting is produced by agents rather than assembled by people. Founded in 2023 in San Francisco and backed by a $5M Foundation Capital seed, it now serves 100+ revenue teams.
⚙️ What it actually does
The reporting stack runs on named agents. The Analyst agent answers ad-hoc revenue questions on demand. The Deal Driver agent watches every open deal and flags risk. The CRM Manager agent writes fields back after each call.
Underneath sits the Context Graph, an intelligence layer that combines CRM object association with 100+ revenue-specific language models and a Process Graph encoding how your company sells.
🔑 Key features for reporting
Automated executive summaries. One-page briefs delivered without a manual roll-up, which is the Monday artifact managers currently hand-build.
Spreadsheet-like analysis. RevOps teams can query and slice revenue data directly, instead of writing custom code against a reporting API.
Custom methodology fields. Reviewers report filling out custom frameworks like MEDIC-BAND automatically from call content.
Forecast agent. Prepares weekly and monthly forecasts rather than waiting for a human to compile them, which is the core of any AI sales forecasting software evaluation.
CRM writeback. Automatic post-call updates to Salesforce, HubSpot, and Zoho, across 70+ integrations.
💰 Pricing and implementation
Pricing starts at $19 per user per month for the notetaker entry tier, with agents added one at a time rather than bought as a suite on day one. That matters if your budget is already committed elsewhere.
Setup is fast in practice. One reviewer describes a five-to-fifteen-minute configuration. Another describes forward-deployed engineers finishing a full rollout in under a week.
✅ Pros and ❌ cons
✅ Reporting is generated and acted on, not just displayed
✅ Automatic CRM updates after every call, verified in multiple G2 reviews
✅ Entry pricing at $19/user/month with modular agent expansion
✅ Fast deployment, reported in days rather than quarters
❌ Dashboard and analytics customization is the most common request in Oliv's own reviews
❌ Reviewers report occasional slowness and a basic mobile app
❌ Not the right fit for pure call-recording use cases or teams unwilling to let agents act
🗣️ Real user feedback
"The Analyst agent allows me to understand everything I need with just one click, eliminating the long wait time I used to have with RevOps to get answers. The Driver agent watches all my deals and flags any that are at risk, so I don't have to spend hours listening to recordings in tools like Gong and Clari." Verified User, 17 Jun 2026Oliv AI G2 Verified Review
"I'd love to see few more options to customize dashboards and reports for different teams." Verified User, 26 Jun 2026Oliv AI G2 Verified Review
"The main downside is that the analytics could be more customizable. It's a minor issue, but having more flexibility in how I view and configure analytics would make it even better." Verified User, 8 Jul 2026Oliv AI G2 Verified Review
I want to be honest about that second and third quote. The dashboard-customization gap is real, and it is the predictable trade-off of an agent-first design. Oliv AI's bet is that a delivered one-pager beats a configurable chart nobody opens, though I might be weighting that preference more heavily than a BI-minded RevOps lead would.
🎯 Best use case
A 25-to-200-rep mid-market B2B team where managers still hand-build the Monday forecast, and where CRM hygiene is the root cause of bad reporting.
Oliv AI's reporting layer is an agent, not a dashboard: the Analyst agent answers ad-hoc revenue questions and the forecast agent ships weekly and monthly roll-ups without a manual scrub.
1.2 Anaplan [toc=1.2 Anaplan]
Anaplan's GTM planning dashboard models customer tiers, bookings targets, and renewal assumptions, connecting sales and finance data into unified revenue reporting for defensible, AI-driven forecasts and executive summaries.
Anaplan is a connected-planning platform used for finance-grade revenue modeling, scenario analysis, and variance reporting. It is the right pick when your reporting question is "what happens to revenue if we change three assumptions," not "which deal is at risk."
🧮 What it actually does
Anaplan builds multidimensional models where a single variable change updates the entire dataset and every dashboard built on it. Reviewers use it for forecasting, sales projections, resource planning, and aging reports.
Its scope has widened beyond finance into sales, supply chain, retail, and workforce planning. Financial Close and Consolidation solutions were added recently, plus prebuilt applications that reviewers say cut implementation by two to three weeks.
🔑 Key features for reporting
Variable-driven dashboards. Update one risk factor and the full dataset and visual layer recalculate together.
Dynamic scenario and variance analysis. Run in-app, without exporting to a separate BI tool.
Low-code model building. Business users can maintain models after the initial implementation.
Prebuilt planning applications. Shorten deployment for standard finance use cases.
📅 Anaplan reporting capability, then and now
Anaplan Product Update Timeline for Revenue Reporting
Period
What was in the product
Through 2025
Connected planning across finance, sales, supply chain, retail, and workforce, with dashboard reporting, scenario and variance analysis, and low-code model building maintained by business users, per verified G2 reviewer detail
Late 2025 into 2026
Financial Close and Consolidation solutions added, prebuilt applications reducing implementation by two to three weeks, and improved third-party integration via ADO for faster multi-source data pulls, per verified G2 reviewer detail
Expected next
Reviewers point to continued expansion of AI and generative features, currently described as costly with narrow use cases, alongside pressure to improve large-dataset performance and Excel-based ad-hoc analysis, per verified G2 reviewer detail
💰 Pricing and implementation
Anaplan uses enterprise licensing without public list pricing. Reviewers consistently flag the cost, describing an expensive licensing model where scalability "comes at a significant expense".
Implementation is a project, not a setup. Prebuilt apps help, but expect a modeling exercise with a partner or an internal Anaplan-certified builder.
✅ Pros and ❌ cons
✅ Best-in-class scenario modeling and variance analysis for revenue planning
✅ One variable change cascades through the full dataset and dashboards
✅ Low-code maintenance after go-live, plus responsive support
❌ Limited API makes real-time syncing to warehouses like Snowflake difficult, so reviewers schedule batch syncs instead
❌ Performance degrades on large datasets, and licensing is repeatedly called expensive
❌ Ad-hoc Excel analysis is weaker than rival EPM tools, forcing work back into the application
❌ Role-based access described as inflexible, pushing teams to over-assign admin roles
🗣️ Real user feedback
"Anaplan does not integrate seamlessly with third party platforms given its limited API. Therefore, it is difficult to sync data between Anaplan and our Snowflake data warehouse in real-time." Verified User, 3 Jun 2025Anaplan G2 Verified Review
"I think role-based access could use an improvement. It wasn't very flexible at the time I was using it. Everyone used to have access to the same dataset." Verified User, 14 Jan 2026Anaplan G2 Verified Review
"Anaplan has consistently faced challenges due to its expensive licensing model and performance limitations when handling large datasets. The basic AI and Gen AI features are not only costly but also have a very limited user base." Verified User, 9 Nov 2025Anaplan G2 Verified Review
🎯 Best use case
A finance-led revenue reporting mandate at enterprise scale, where modeling depth matters more than deal-level action, and where a dedicated planning team already exists.
Oliv AI takes the opposite position on the same problem: instead of modeling revenue in a planning layer, its agents work inside the CRM your reps already use, so the reported number and the recorded number stay the same.
1.3 Aviso [toc=1.3 Aviso]
Aviso's revenue cycle view layers forecast, pipeline, and rep activity snapshots with account engagement trends, showing how revenue reporting software turns scattered deal data into faster decisions.
Aviso is an AI forecasting platform used mainly by enterprise sales orgs that want a predicted number alongside the rep-submitted one. On reporting specifically, it is the weakest performer in this list based on verified reviews.
🔍 What it actually does
Aviso ingests CRM data and produces AI forecast scores, segment roll-ups, and rep-level views. Managers filter by owner name to prep one-on-ones and forecast calls.
The core promise is a second opinion on the forecast. The reporting layer around it is where reviewers report friction.
🔑 Key features for reporting
Left-hand group filters. Filter by owner or segment to isolate one rep before a forecast call.
AI forecast scoring. A predicted number sits next to the submitted number.
Segment roll-ups. Views by team, region, or hierarchy.
SFDC sync. Data flows from Salesforce, though reviewers report reliability gaps.
💰 Pricing and implementation
Aviso sells enterprise contracts with quote-based pricing. No public list price exists.
Implementation depends heavily on internal enablement. One reviewer describes adoption with "no internal support or training provided," which is a rollout problem as much as a product one.
✅ Pros and ❌ cons
✅ Owner-level filtering makes one-on-one prep straightforward
✅ AI-generated forecast scores give managers a challenge number
❌ Exporting data "loses all customisations and filters," which breaks custom reporting workflows
❌ Reviewers report slow performance when switching between segments
❌ SFDC sync failures and update lag reported, forcing Excel workarounds
❌ Analytics described as ineffective by multiple reviewers
🗣️ Real user feedback
"Extremely slow performance, especially when switching between segments. Exporting data loses all customisations and filters. Analytics are ineffective and add no real value." Verified User, 24 Jun 2025Aviso G2 Verified Review
"The solution is slow, often times it doesn't sync with SFDC, the reports are terrible and don't represent what is being pulled by the data." Verified User, 18 Feb 2025Aviso G2 Verified Review
"I like being able to filter by group on the left-hand side. I often filter by the owner name so that I can easily zero in on one individual when I'm doing a one-on-one or through my forecast call." Verified User, 8 Dec 2025Aviso G2 Verified Review
That export complaint is the one I would test in a demo. A report that loses its filters on export is not a report. It is a screenshot with extra steps.
🎯 Best use case
A large enterprise that already mandates a second forecast opinion and has an internal enablement team ready to support the rollout.
Oliv AI approaches the same forecast-call problem differently: its forecast agent prepares the weekly and monthly roll-up before the call, so managers review a number rather than rebuild one.
1.4 Clari [toc=1.4 Clari]
Clari's Revenue Context page pairs a seller with AI prompts for quarterly predictions, coaching, and daily focus, illustrating agent-generated insights that feed executive revenue reporting and analytics views.
Clari is the category-defining pipeline inspection and forecast platform. It is pre-generative AI in architecture, built to show you the pipeline rather than act on it, and its feature set reflects that origin.
📈 What it actually does
Clari pulls Salesforce data into forecast views, inspection views, and waterfall analysis. Reviewers use it instead of native Salesforce forecasting because the roll-up happens automatically.
It has since expanded into cadences, dialing, and conversation intelligence. Reviewers say the newer layers are less mature than the forecasting core.
🔑 Key features for reporting
Out-of-the-box dashboards. Strong prebuilt analytics with minimal configuration.
Weekly forecast and opportunity analysis. Week-over-week drill-down into individual deals.
Flow View and Waterfall View. Pipeline movement analysis, though reviewers report both underperforming.
Inspection View presets. Standardizing the display still takes extra work.
Email engagement tracking. Open and receipt signals feed deal-strength reads.
💰 Pricing and implementation
Clari uses enterprise quote-based pricing with no public list rate. For a 25-to-200-rep team, stacking Clari with Gong and Salesloft is how total cost quietly clears $500 per user per month, which is why the Clari alternatives conversation keeps coming up.
✅ Forecasting is simple, fast, and well integrated with Salesforce
✅ Out-of-the-box dashboards and cadence analytics are genuinely robust
✅ Smooth implementation reported repeatedly
❌ "There's no custom reporting," per a July 2026 reviewer
❌ CRM writeback described as "not good," with MEDDIC values unable to return to Salesforce
❌ AI features called immature, with weak integration to non-Salesforce systems
❌ Connection drops with Salesforce, Gmail, and calendar require app restarts
🗣️ Real user feedback
"There's no custom reporting. The CRM writeback is not good; we cannot send MEDDIC values back to Salesforce or update fields in Salesforce from the conversation intelligence. The AI is not as flexible as we need it to be." Verified User, 13 Jul 2026Clari G2 Verified Review
"The AI features are immature, team activity is poorly designed, and it doesn't integrate well with other popular business systems today." Verified User, 10 Oct 2025Clari G2 Verified Review
"I'm concerned that the advanced 'Flow View' and 'Waterfall View' aren't working well. I also find it inconvenient that it still takes extra work to get the 'Inspection View' display standardized using presets." Verified User, 16 Nov 2025Clari G2 Verified Review
Read that first quote again. Two of the four artifacts this article is about, custom reports and writeback, are named as gaps by a paying user.
🎯 Best use case
A Salesforce-standardized enterprise where forecast roll-up speed matters more than custom reporting or field-level writeback.
Oliv AI closes exactly the loop Clari reviewers flag: its CRM Manager agent writes methodology fields, including custom frameworks like MEDIC-BAND, back into Salesforce and HubSpot after each call.
1.5 Forecastio [toc=1.5 Forecastio]
Forecastio is a HubSpot-native sales performance and forecasting tool built for smaller revenue teams. It is the pragmatic pick when Clari and Anaplan are overbuilt for your headcount.
🧭 What it actually does
Forecastio sits directly on HubSpot data and produces forecasts, performance reports, and goal tracking. There is no separate data pipeline to maintain.
It targets sales leaders at 10-to-100-rep companies who need reporting rigor without a RevOps hire.
🔑 Key features for reporting
HubSpot-native sync. No middleware, no warehouse dependency.
Sales performance reporting. Conversion, velocity, and win-rate views by rep and stage.
Goal and quota tracking. Attainment views tied to plan.
Scenario-light forecasting. Simpler than a planning platform, faster to configure.
💰 Pricing and implementation
Forecastio publishes SMB-friendly tiers well below enterprise revenue platforms. Deployment is measured in hours because the CRM is the data source.
✅ Pros and ❌ cons
✅ Native HubSpot data model, so numbers match the CRM
✅ Affordable relative to enterprise revenue platforms
✅ Fast to deploy without a RevOps team
❌ HubSpot-only, so Salesforce shops are excluded
❌ No conversation data, so pipeline reads stay CRM-dependent
❌ Reporting depth is thinner than dedicated analytics platforms
🎯 Best use case
A HubSpot-based team under 100 reps that needs credible forecast reporting and cannot justify enterprise licensing.
Oliv AI serves the same HubSpot-first buyer at a similar entry point, starting at $19 per user per month, with agents added one at a time rather than as a suite.
1.6 Gong [toc=1.6 Gong]
Gong is the conversation-intelligence platform that became a Revenue AI Operating System. It has the deepest data set on this list and, per reviewers, the tightest grip on it, which is why buyers keep researching Gong alternatives.
🎙️ What it actually does
Gong records, transcribes, and analyzes calls, then layers dashboards, forecast boards, and AI briefs on top. Founded in 2015, its conversation-intelligence core is still the center of the product.
Reporting arrived properly in October 2024 with Revenue Analytics, described as "robust, configurable, and dynamic dashboards."
Configurable forecast boards. Spreadsheet-like boards covering new business, renewals, upsells, and net revenue, shipped November 2025.
AI briefs. Customizable summaries at homepage, deal, account, and call level, shipped May 2025.
Data Extractor. Extracts AI fields from conversations and maps them to CRM, shipped December 2025.
Data Studio metrics. Metrics built on related object fields, added May 2026.
📅 Gong reporting capability, then and now
Gong Reporting Product Updates, 2025 to 2026
Period
What shipped
Through 2025
Revenue Analytics dashboards on custom metrics, AI briefs across deal, account, and call surfaces, Agent Studio for managing AI agents, and configurable spreadsheet-like forecast boards covering renewals and net revenue
Feb to May 2026
Mission Andromeda launched Gong Enable with conversational guidance and unified account management on 25 Feb 2026, followed by Snowflake multi-instance connectivity and Data Studio metrics built from related object fields
Expected next
Bidirectional Model Context Protocol support so the AI Briefer pulls third-party data into briefs and external AI platforms query Gong, plus brief generation via API across calls, contacts, accounts, and deals
💰 Pricing and implementation
Gong does not publish list pricing. Per-seat pricing became visible inside the admin center for eligible direct-purchase accounts in June 2025, and Gong Enable is a separate paid module, which complicates any Gong pricing comparison.
Reviewers describe setup friction, particularly around AI tracker configuration and real-time integrations.
✅ Pros and ❌ cons
✅ Deepest conversation data set, with strong AI theme detection across departments
✅ Genuinely configurable dashboards and forecast boards since late 2025
✅ Active shipping cadence, with monthly release notes and ARR past $500M as of May 2026
❌ "Limitations of getting data back into salesforce," per a May 2026 reviewer
❌ Full data download gated behind a plan upgrade, with snippets copied one by one
❌ AI tracker setup UI described as difficult
❌ Data is lost when you stop paying, per a March 2026 reviewer
🗣️ Real user feedback
"limitations of getting data back into salesforce" Verified User, 21 May 2026Gong G2 Verified Review
"I cannot download all the data myself unless we upgrade the plan, which isn't ideal and results in me not fully utilizing Gong. The requirement to download snippets one by one using copy and paste is particularly annoying." Verified User, 3 Oct 2025Gong G2 Verified Review
"The fact that you can't edit a recording (to only share a portion with a client), and the fact that if you stop working with the tool you lose the data." Verified User, 19 Mar 2026Gong G2 Verified Review
Oliv AI's read here goes against the usual Gong critique. The problem is not the analysis quality, which is strong. It is that RevOps teams write custom code to extract data for their own analysis, when what they need is a spreadsheet-like surface. I could be over-indexing on the teams that came to us specifically for that reason.
🎯 Best use case
An enterprise where conversation data is the strategic asset and a dedicated analytics team can work around export limits.
Oliv AI takes the opposite stance on data portability: its agents push structured deal data back into Salesforce, HubSpot, and Zoho as the default output, not as an upgrade tier.
1.7 InsightSquared [toc=1.7 InsightSquared]
InsightSquared is a sales analytics platform known for a large prebuilt report library. It is the right pick when you want reports that already exist rather than reports you have to build.
📚 What it actually does
InsightSquared connects to the CRM and delivers hundreds of prebuilt reports covering pipeline, activity, conversion, and forecast. A report builder handles the rest.
It grew up in the pre-generative-AI era, so the model is dashboard-and-drill-down rather than agent-and-action.
🔑 Key features for reporting
Prebuilt report library. Wide coverage without building from scratch.
Custom report builder. For metrics outside the standard set.
Activity and pipeline analytics. Rep-level and team-level views.
Forecast roll-ups. Submitted versus predicted comparisons.
💰 Pricing and implementation
Mid-market tiers, quote-based. Implementation depends on CRM data quality, which is the recurring theme across every tool in this category.
✅ Pros and ❌ cons
✅ Large prebuilt library shortens time to first report
❌ No conversation data, so reporting inherits CRM hygiene problems
❌ Attribution views are limited
❌ Executive summaries remain a manual build
🎯 Best use case
A mid-market sales org with clean CRM data that wants breadth of standard reporting fast.
Oliv AI attacks the upstream cause instead: its CRM Manager agent updates fields automatically after calls, so the reports built on top inherit accurate data.
1.8 People.ai [toc=1.8 People.ai]
People.ai is an activity-capture and account-intelligence platform. It answers "who did we actually talk to" better than anything else on this list.
🕸️ What it actually does
People.ai captures emails, meetings, and contacts, then maps them to accounts and opportunities. That relationship graph feeds coverage reports and engagement analysis.
For attribution work, this contact-to-opportunity mapping is genuinely useful. Most reporting tools cannot answer it at all.
🔑 Key features for reporting
Automated activity capture. Emails and meetings logged without rep effort.
Contact-to-opportunity mapping. Buying-group coverage per deal.
Account engagement dashboards. Multi-threading depth by account.
CRM activity writeback. Captured activity flows into the system of record.
💰 Pricing and implementation
Enterprise, quote-based. Deployment involves email and calendar permissioning, which is a security review, not a config change.
✅ Pros and ❌ cons
✅ Best-in-class activity capture and relationship mapping
✅ Contact-level attribution most reporting tools cannot produce
✅ Writes activity back to CRM automatically
❌ Not a forecast or executive-summary tool
❌ Value depends on broad email and calendar access approval
❌ Reporting is engagement-led, not revenue-recognition-led
🗣️ A note on activity capture
Activity capture tools break in a specific way I have watched repeatedly. Emails get flagged as sensitive and excluded, so the customer picture has holes nobody notices until a QBR.
An enterprise running multi-threaded deals where buying-group coverage is a reported metric.
Oliv AI treats activity capture as an input rather than the product: its Context Graph associates activity to the correct CRM object before agents act on it.
1.9 Revenue Grid [toc=1.9 Revenue Grid]
Revenue Grid is a guided-selling and Salesforce sync platform with signal-based dashboards. It targets teams that want nudges alongside numbers.
🚦 What it actually does
Revenue Grid monitors pipeline and generates signals when deals stall or steps get skipped. Reporting sits on top of that signal layer.
It is closer to the act layer than Clari or InsightSquared, though the actions are alerts rather than completed work.
🔑 Key features for reporting
Signal dashboards. Alerts on stalled deals and missed steps.
Configurable reports. Pipeline and activity views by team.
Mid-market tiers, quote-based, with a Salesforce-centric deployment.
✅ Pros and ❌ cons
✅ Signal engine surfaces risk without manual inspection
✅ Reliable Salesforce bidirectional sync
✅ Mid-market pricing
❌ Signals still hand the work back to a human to complete
❌ Attribution views limited
❌ Smaller review base than Clari or Gong, so evidence is thinner
🎯 Best use case
A Salesforce-based mid-market team that wants guided-selling nudges plus reporting in one contract.
Oliv AI's distinction here is narrow but real: instead of alerting a rep to update a field, its Deal Driver agent flags the risk and the CRM Manager agent completes the update.
1.10 Salesforce [toc=1.10 Salesforce]
Salesforce is the default revenue reporting tool for most companies because it is already paid for. Native reports and dashboards handle more than teams assume.
🏛️ What it actually does
Salesforce reports and dashboards run directly on your opportunity data. Report types, filters, and joined reports cover a wide range of revenue questions without any third-party tool.
Where it struggles is anything requiring conversation context, narrative summaries, or data your reps never entered.
🔑 Key features for reporting
Native report builder. Custom report types, filters, and joined reports.
Dashboards. Component-level charts on live opportunity data.
Forecasting module. Native roll-ups by hierarchy.
Einstein activity capture. Automated email and meeting logging, with known exclusion behavior.
Agentforce. Action-credit-priced agents layered on the platform, covered in detail in this Agentforce pricing breakdown.
💰 Pricing and implementation
Per-seat licensing you already pay, plus consumption pricing for agent actions. Action-credit models make monthly spend hard to predict as usage scales.
Implementation is admin work, not procurement. That is the real advantage.
✅ Pros and ❌ cons
✅ Zero incremental license cost for core reporting
✅ Native writeback because it is the system of record
✅ Deep customization through report types and formula fields
❌ Reports are only as good as what reps manually enter
❌ Executive summaries are entirely manual
❌ Activity capture exclusion rules create silent data gaps
❌ Agent action credits make spend unpredictable at volume
🎯 Best use case
Any team with disciplined CRM hygiene and a competent admin. Start here before buying anything, and buy only where Salesforce genuinely cannot answer the question.
Oliv AI is built on that premise: it plugs into Salesforce, HubSpot, and Zoho to make them accurate rather than asking teams to report somewhere else.
1.11 Salesloft [toc=1.11 Salesloft]
Salesloft is an engagement platform with cadence and activity analytics. On revenue reporting, it is the narrowest tool here, and reviewer sentiment on data reliability is poor.
📬 What it actually does
Salesloft sequences outreach and reports on engagement: opens, replies, calls, and cadence performance. Managers use it for top-of-funnel observability.
It reports activity, not revenue. That distinction matters when it appears on revenue reporting shortlists, and it shapes any Gong versus Salesloft evaluation.
🔑 Key features for reporting
Cadence analytics. Step-level performance across sequences.
Activity and dialer metrics. Call and email volume by rep.
Engagement tracking. Opens and replies, with reported accuracy issues.
CRM sync. Salesforce connectivity, with reported reliability gaps.
💰 Pricing and implementation
Per-seat tiers. Reviewers repeatedly describe difficult initial setup and a steep learning curve.
✅ Pros and ❌ cons
✅ Brings structure to high-volume outreach and follow-up
✅ Cadences and templates centralized in one place
❌ "Analytics/metrics are faulty like email opens," per a March 2025 reviewer
❌ Data connectivity issues between CRM, Sales Navigator, and the app
❌ Meeting logging problems reported, which corrupts activity reporting
❌ No conditional-logic automation, per a September 2025 reviewer
🗣️ Real user feedback
"Analytics/metrics are faulty like email opens... A handful of features don't work properly (inbound calls, task reminders, data connectivity between apps (CRM, Sales Nav)." Verified User, 26 Mar 2025Salesloft G2 Verified Review
"I often have trouble logging meetings, and certain features feel clunky or overly manual. The learning curve can be frustrating, especially when you're trying to move quickly in a fast-paced environment." Verified User, 22 Jul 2025Salesloft G2 Verified Review
"For months, randomly, one-off emails sent from Salesloft (not sequences) would appear blank in the recipient's mailbox... No automations based on conditional logic." Verified User, 24 Sep 2025Salesloft G2 Verified Review
If engagement metrics are unreliable at the source, every downstream report inherits the error. That is worth more scrutiny than any dashboard feature.
🎯 Best use case
An outbound-heavy team that needs cadence execution, with revenue reporting handled elsewhere.
Oliv AI is not an engagement platform, and pairing it with a sequencer is a reasonable stack. The difference is that Oliv's agents complete post-call work rather than reporting that it did not happen.
1.12 Terret (formerly BoostUp) [toc=1.12 Terret]
Terret, previously BoostUp, is a revenue command-center platform competing directly with Clari on configurable dashboards and forecast rigor.
🎛️ What it actually does
Terret unifies CRM, activity, and conversation data into configurable revenue views. The pitch is flexibility, positioned against Clari's more fixed structure.
For teams that hit Clari's custom-reporting wall, Terret is the usual next evaluation alongside other revenue orchestration platforms.
🔑 Key features for reporting
Configurable command-center dashboards. Built around your metric definitions.
Forecast submission and roll-up. Multi-level hierarchy support.
Conversation and activity signals. Feeding deal-health views.
CRM sync. Bidirectional with Salesforce.
💰 Pricing and implementation
Enterprise, quote-based. Implementation is a configuration project because flexibility is the product.
✅ Pros and ❌ cons
✅ More configurable reporting than Clari's out-of-the-box structure
✅ Multi-stream forecasting including renewals
✅ CRM sync in both directions
❌ Configuration effort is the cost of that flexibility
❌ Attribution views remain partial
❌ Smaller review base than Clari or Gong, so buyer evidence is thinner
❌ Executive summaries still require assembly
🎯 Best use case
An enterprise RevOps team with the capacity to configure its own metric definitions and a specific complaint about a rigid incumbent.
Oliv AI's read is that configurability is the wrong axis for most mid-market teams. We see managers who do not want a better report builder. They want the Monday one-pager already written, which is what the forecast agent delivers.
Which profile picks which tool
Buyer Profile to Tool Match for Revenue Reporting
Your situation
Start with
Managers hand-build the Monday forecast
Oliv AI, agent-generated briefs plus CRM writeback
Finance owns revenue modeling at enterprise scale
Anaplan, despite licensing cost
Salesforce-standardized, forecast speed over custom reports
Clari
Conversation data is the strategic asset
Gong
HubSpot shop under 100 reps
Forecastio
Buying-group coverage is a reported metric
People.ai
CRM hygiene is already strong and budget is zero
Salesforce native reports
Oliv AI sits at position one for a narrow reason worth stating plainly: across this list, reviewers name custom reporting and CRM writeback as the two most common gaps, and Oliv's agents are built to close both.
Q2. How did we score and select these revenue reporting tools? [toc=2. Scoring Methodology]
Every tool was scored out of 100 across five criteria: Reporting Depth and Custom Report Flexibility (25%), Agentic Action versus Dashboard-Only (25%), Attribution and Cross-Functional Data Coverage (20%), Setup and Time-to-First-Report (15%), and Pricing Transparency (15%). Scores of 0 to 20 earn one star, 21 to 40 two, 41 to 60 three, 61 to 80 four, and 81 to 100 five.
⭐ Why these five weights, and not popularity
Reporting depth and agentic action carry equal top weight for one reason. A tool that shows you a number and a tool that writes the report are doing different jobs at different costs.
Attribution sits at 20% because it is the rarest capability in this category. Setup time and pricing transparency split the last 30%, since both decide whether the tool actually gets used.
🔬 How each criterion was evidenced
Three evidence types only. Verified G2 reviews from the last 24 months, vendor documentation and release notes, and hands-on setup timing.
No vendor marketing claims were scored. When a vendor said "robust reporting" and a reviewer said "there's no custom reporting," the reviewer won. G2's Revenue Operations and Intelligence category, built on thousands of verified reviews, was the base pool for this survey of revenue intelligence software platforms.
⚖️ How to re-weight this for your own context
The weights above assume a mid-market B2B SaaS buyer. Shift them if your situation differs.
Under 50 reps: raise Setup and Pricing Transparency to 40% combined, and drop Attribution to 10%.
Complex revenue model (usage-based, multi-entity): raise Reporting Depth to 35%.
Real ASC 606 exposure: add a pass/fail compliance gate before scoring anything.
Enterprise with a RevOps team: raise Attribution, since you have the people to use it.
📉 The metric trap that skews most rubrics
Activity metrics with no link to deal advancement are hollow. Call counts and email volume look like reporting, but they predict nothing.
I score any tool down when its headline dashboard is activity volume. Glorified scorekeepers make poor forecasters, and that is true of software as much as managers.
🧮 The 10/80/10 test applied to tools
Oliv AI's evaluation frame is the 10/80/10 rule: you spend 10% defining the reporting outcome, the tool does 80% of the lifting, and you spend 10% on a quality check. Any platform demanding 80% human effort loses points, no matter how good the charts look.
⭐ Final scores across all twelve tools
Revenue Reporting Software Scores Out of 100 (2026)
Tool
Score
Stars
Where it lost points
Oliv AI
88
⭐⭐⭐⭐⭐
Dashboard customization, flagged in its own reviews
Gong
74
⭐⭐⭐⭐
Export gating and Salesforce writeback limits
Clari
62
⭐⭐⭐
No custom reporting, weak CRM writeback
Terret (BoostUp)
60
⭐⭐⭐
Configuration effort, thin buyer evidence
Anaplan
58
⭐⭐⭐
Limited API, costly licensing, and large-dataset lag
People.ai
57
⭐⭐⭐
Not a forecast or summary tool
Salesforce
55
⭐⭐⭐
Manual summaries, unpredictable agent credits
Forecastio
54
⭐⭐⭐
HubSpot-only, no conversation data
Revenue Grid
52
⭐⭐⭐
Alerts stop short of completing work
InsightSquared
50
⭐⭐⭐
No conversation layer, limited attribution
Aviso
34
⭐⭐
Exports lose filters, SFDC sync failures
Salesloft
30
⭐⭐
Faulty engagement metrics at the source
🗣️ What reviewers said that moved scores
"There's no custom reporting. The CRM writeback is not good." Verified User, 13 Jul 2026Clari G2 Verified Review
"Additionally, setting up Oliv.ai was straightforward and could be done in just five to fifteen minutes." Verified User, 15 Jun 2026Oliv AI G2 Verified Review
"Extremely slow performance, especially when switching between segments. Exporting data loses all customisations and filters." Verified User, 24 Jun 2025Aviso G2 Verified Review
Oliv AI scores 88 on this rubric: setup timed at 5 to 15 minutes by reviewers, entry pricing at $19 per user per month, and an agent layer that completes work instead of returning it. The 12 points it loses are dashboard customization, and that gap is named by its own users.
Q3. What is revenue reporting software, and which category do you actually need? [toc=3. Definitions and Categories]
Revenue reporting software unifies CRM, billing, and warehouse data to produce dashboards, custom reports, attribution views, and executive summaries. Recognition software governs when revenue may be booked under ASC 606 and IFRS 15. Intelligence software predicts pipeline outcomes. Reporting explains what happened and why, recognition governs what you may book, and intelligence forecasts what comes next.
🧾 Three categories the market keeps confusing
These three get sold as one thing. They are not.
Revenue Reporting vs Recognition vs Intelligence
Dimension
Reporting
Recognition
Intelligence
Core question
What happened, and why
What may we book, and when
What happens next
Owner
RevOps, sales leadership
Finance, controller
Sales leadership, RevOps
Output
Dashboards, reports, summaries
Deferred schedules, audit trail
Forecasts, risk scores
Standard
Internal metric definitions
ASC 606, IFRS 15
Model accuracy
Example tool
Oliv AI, Clari, Gong
ERP revenue modules
Aviso, Clari
💰 One contract, three different answers
Take a $1,200 annual SaaS contract signed in January. Reporting tells you it came from a partner referral and closed in 34 days.
Recognition spreads it as $100 per month across twelve months. Intelligence flags in month nine that usage dropped and renewal is at risk. Same contract, three separate systems, three different jobs.
🗂️ The six categories, and who each fits
CRM-based tracking. Native Salesforce or HubSpot reports. Fits teams with clean data and no budget.
Accounting suite reporting. QuickBooks or Xero reports. Fits companies under $10M with simple revenue.
Subscription billing analytics. Stripe, Chargebee, and Maxio. Fits recurring or usage-based models.
Dedicated revenue automation. Oliv AI, Clari, Gong, and Terret. Fits mid-market and enterprise teams where reporting must drive action, which is the core promise of revenue orchestration platforms.
ERP revenue modules. NetSuite, SAP, and Oracle. Fits multi-entity companies with real compliance exposure.
General BI layer. Tableau, Power BI, and Qlik. Fits teams with a data engineer and a warehouse.
🧪 Two decision tests before you buy
The BI-is-enough test. If you already have a warehouse, a data engineer, and stable metric definitions, a BI tool is enough. Buy a revenue platform only when nobody owns the definitions or the reports arrive too late to act on.
The ERP-sufficiency test. Your ERP is enough when revenue is contract-based and predictable, and finance is the only consumer of the report. Add a dedicated platform when revenue is usage-based or when sales leadership needs attribution and narrative summaries the ERP cannot produce.
⚠️ The compliance gate that ends shortlists early
If you have real ASC 606 or IFRS 15 exposure, this is a pass/fail check, not a scoring criterion. Four requirements, all non-negotiable.
Contract-level deferred revenue schedules, not aggregate journal entries.
Automatic adjustments for upgrades, downgrades, and cancellations mid-term.
Multi-currency and multi-entity consolidation.
An exportable audit trail an external auditor can trace to the source transaction.
🏛️ The dumb-repository problem
Running a revenue org on a system reps update only because management demands it is not reporting. It is compliance theatre with charts attached.
The honest test is simple. If your reps stopped updating the CRM tomorrow, how much of your reporting would survive? For most teams, the answer is almost none, which tells you the reporting tool was never the problem, and it explains why the shift from RevOps to intelligence to orchestration keeps stalling.
Oliv AI operates in the reporting and action layer, plugging into Salesforce, HubSpot, and Zoho rather than replacing them, so recognition stays in finance's system of record. That split matters: agents make the CRM accurate, and the controller keeps control of the ledger.
Q4. Why do dashboards keep failing sales managers on Monday morning? [toc=4. The Dashboard Failure]
Dashboards fail because they shift the analysis onto the manager. Every Thursday and Friday, managers spend one to two hours per rep reconstructing pipeline movement, then hand-build Monday's report. Meanwhile 55% of sales leaders lack high confidence in their forecast. The fix is not another tile. It is a one-page brief that arrives already reasoned.
⏰ What the Thursday scrub actually costs
Picture a manager with eight reps. Thursday and Friday go to one-on-ones, one to two hours each, reconstructing what moved and why.
That is 8 to 16 hours a week spent assembling a number, not improving it. The dashboard did not save that time. It created it, by presenting data that still needs a human to interpret.
🚿 Senior time spent digging, not deciding
The habit I see most is managers listening to call recordings while driving and reading dashboards in odd gaps of the day. They are doing manual data archaeology on their own time, and it is the pattern that pushes teams toward AI for sales calls in the first place.
That is the most expensive labor in the org, spent on the least leveraged task. Nobody puts it on a slide because it does not look like a problem. It looks like diligence.
🔄 The twist: reconciliation, not visualization
Here is where the standard advice gets it backwards. Everyone treats bad reporting as a visualization problem, so they add a tool.
Each added tool makes the stack more brittle, not more resilient. Around a third of finance leaders name revenue recognition and reconciliation as the hardest processes to scale. Board numbers break at the join between systems, not at the chart.
📈 The accuracy ladder is coachable
Forecast accuracy is not a chart feature. It is a ladder you climb with process discipline, and it is the real benchmark for any AI sales forecasting software.
Below 70%: pipeline visibility or stage definitions are broken.
70 to 85%: where most B2B SaaS teams sit today.
90 to 95%: top-performer range, meaning actuals land within 10% of forecast.
96% by week two: the vendor-claimed upper bound, useful as a reference point, not a promise.
Only 41% of sales managers and executives are satisfied with their current dashboards for decision-making. That is not a design complaint. It is a job-allocation complaint.
📄 The design target: one page, already reasoned
The artifact worth building toward is narrow. You sit down Monday morning, and a one-page document is already in your inbox, focused on the top five to ten deals that actually matter.
Not 40 tiles. Not a drill-down path. A brief that has already done the reasoning, with the source numbers traceable underneath.
✅ The tactic to run this week
Before you evaluate a single tool, run this in your next pipeline review. If a rep cannot articulate the exact status of a deal, push it off the forecast.
No debate, no split commit. This one rule surfaces more forecast error in a week than a new dashboard will in a quarter, and it costs nothing. Pair it with a qualification framework like MEDDIC so "exact status" means something specific.
Oliv AI was built against this exact workflow: its forecast agent assembles the weekly and monthly roll-ups, so the Thursday scrub becomes a review instead of a reconstruction. One reviewer reports forecast accuracy up 27% after the switch, which I read as process discipline finally being enforced by software rather than by memory.
Q5. Dashboards, custom reports, attribution views, or executive summaries: which one actually moves revenue? [toc=5. Four Reporting Artifacts]
Treat them as four separate jobs. Dashboards monitor, custom reports investigate, attribution views assign credit, and executive summaries narrate. Most platforms are strong on one and weak on three. Ask each vendor to build a custom report live, then ask who verifies the narrative before leadership reads it. That test separates the shortlist fast.
📊 The four artifacts, and the job each one holds
Every buyer says they want "better reporting." Push on it, and four different requests fall out.
Dashboards answer "is anything off?" You glance at them daily.
Custom reports answer "why is that off?" You build them when something looks wrong.
Attribution views answer "what should we fund next?" They connect source to closed revenue.
Executive summaries answer "what do I tell the board?" They need reasoning, not tiles.
❌ Where the market actually breaks
Across verified G2 reviews from the last 24 months, two gaps repeat more than any others. Custom reporting and CRM writeback.
"There's no custom reporting. The CRM writeback is not good; we cannot send MEDDIC values back to Salesforce or update fields in Salesforce from the conversation intelligence." Verified User, 13 Jul 2026Clari G2 Verified Review
"limitations of getting data back into salesforce" Verified User, 21 May 2026Gong G2 Verified Review
Two different platforms, two different price points, the same structural gap. It is the recurring complaint that drives buyers toward Gong alternatives and rival forecast tools alike.
🔗 Attribution is the near-absent capability
Attribution is the rarest of the four. Most tools stop at pipeline source and never reach recognized revenue.
The reason is a missing join key. You need a single identifier that survives the trip from lead source, through opportunity, into the billing record, and out to recognized revenue. Without it, marketing reports pipeline, finance reports revenue, and the two numbers never reconcile.
🧑⚖️ Executive summaries need a named human verifier
Adoption is not the question anymore. 87% of sales organizations already use some form of AI, and 94% of sales leaders with agents call them critical to meeting business demands.
That makes governance the question. Every AI-written summary that reaches leadership needs one named person who verifies it. Not a policy document, a name.
⭐ Capability grid across the shortlist
Four Reporting Artifacts Compared Across Platforms
Tool
Dashboards
Custom reports
Attribution
Exec summaries
Oliv AI
⭐⭐⭐
⭐⭐⭐⭐
⭐⭐⭐⭐
⭐⭐⭐⭐⭐
Gong
⭐⭐⭐⭐
⭐⭐⭐⭐
⭐⭐⭐
⭐⭐⭐⭐
Clari
⭐⭐⭐⭐
⭐
⭐⭐
⭐⭐
Aviso
⭐⭐
⭐
⭐⭐
⭐⭐
People.ai
⭐⭐⭐
⭐⭐⭐
⭐⭐⭐⭐
⭐⭐
Salesforce
⭐⭐⭐⭐
⭐⭐⭐⭐⭐
⭐⭐⭐
⭐
Salesloft
⭐⭐
⭐⭐
⭐
⭐
Oliv AI covers all four artifacts, though its own G2 reviewers ask for deeper dashboard customization, which is the honest current limit of an agent-first model.
"I'd love to see few more options to customize dashboards and reports for different teams." Verified User, 26 Jun 2026Oliv AI G2 Verified Review
💰 The pricing signal hiding inside the artifact question
Watch how vendors price the investigation layer. Per-seat licensing on an analyst capability financially punishes curiosity, because every extra person who wants to ask a question costs money.
A per-organisation model, priced flat for unlimited users and queries, inverts that. I read that as the clearest tell in the category about whether a vendor wants reporting used or just owned, and it is worth checking against any revenue intelligence software platform on your list.
Oliv AI's Analyst agent answers ad-hoc strategic questions in plain English, returning curated data with interpretive commentary, and reviewers report getting answers in one click instead of queuing with RevOps. One customer's reaction to a report that named three specific rep skill gaps was simply being speechless, which tells me the bar for "reporting" was set very low for a very long time.
Q6. What does revenue reporting software cost, and should you just build it yourself? [toc=6. Cost and Build vs Buy]
Three models compete. Per-seat runs roughly $19 to $500 per user monthly. Per-action credit models charge around $0.10 per agent action, which makes spend unpredictable at scale. Per-organisation pricing, such as $4,999 flat for unlimited users and queries, suits teams where many people ask questions. Build only if reporting is your product.
Oliv AI sits at the bottom of the per-seat range, starting at $19 per user per month, with agents added one at a time rather than as a bundle.
💸 The costs that never appear on the pricing page
Sticker price is maybe 60% of what you actually spend. Four line items get missed.
Implementation. Weeks of RevOps time, even on "easy" tools.
Data integration. Connecting CRM, billing, and warehouse is engineering work.
Consulting for multi-entity setups. Multi-currency configuration is rarely self-serve.
The curiosity tax. Per-seat licensing means fewer people query, so the tool gets used less.
Stack Gong, Clari, and a sequencer for a 25-to-200-rep team, and total cost of ownership clears $500 per user monthly. That is the quiet part of the standard playbook, and it is visible in published Gong pricing tiers once you add the modules.
🔨 The buyer who chose to build, and what broke
I lost a deal to an internal build. Reasonable logic: they already had every call recording, so why pay a vendor?
Three to four months in, they had insights. Real ones, extracted from calls. Then the actual question arrived: how do you relate a call insight to the state of the deal it belongs to? That join, from conversation to opportunity to forecast, was the whole product, and it was the part they had not built.
⚠️ The honest exception
Build when reporting is your product, when you have a data engineer with spare capacity, or when your revenue model is so unusual no vendor matches it.
I say that as someone who builds. Twelve apps shipped on Replit in 150 days, used a million times. Building is not the hard part. Maintaining a data join across four systems while your reps change how they sell is the hard part.
🗣️ What buyers say about cost
"It's more affordable compared to other options we previously used." Verified User, 23 Jun 2026Oliv AI G2 Verified Review
"I cannot download all the data myself unless we upgrade the plan, which isn't ideal and results in me not fully utilizing Gong." Verified User, 3 Oct 2025Gong G2 Verified Review
"Consolidating multiple tools into Oliv has saved us budget and increased our results." Verified User, 8 Jul 2026Oliv AI G2 Verified Review
That Gong quote is a cost problem disguised as a feature gate. Paying for data you cannot fully export is a real line item, and it is one reason consolidation across AI sales tools keeps beating best-of-breed stacking.
Oliv AI's pricing view is that SaaS is now a commodity and should be priced like one: start at $19 per user monthly, audit the workflow, deploy one agent, validate the ROI, then extend. We do it that way because nobody should buy a suite they cannot deploy.
Q7. How do you pressure-test a revenue reporting tool before you sign? [toc=7. Buyer Evaluation Tests]
Run five live tests in one 30-minute demo. Ask the vendor to trace a board number back to its source transaction. Request a custom report built on the call. Ask it to write one field back to your CRM. Ask for the attribution join key. Ask who verifies an AI-written summary before leadership reads it.
⚠️ Why demos fail buyers
In a standard demo, the vendor drives and you watch. You see a polished dataset that was configured for the demo, not for you.
Nothing in that hour tests the thing that will actually hurt you in month four. Take the mouse. Make them build live.
✅ The five tests, with pass criteria
Metric lineage. Pick one number on their dashboard. Ask them to trace it to the source transaction. Pass: they get there in under two minutes, on screen.
Custom report, live. Name a metric you actually use. Pass: it exists before the call ends, no follow-up email.
CRM writeback. Ask them to write one MEDDIC methodology field back to your CRM. Pass: the field updates in your sandbox during the call.
Integration depth. CRM, ERP, Stripe, and warehouse. Pass: named connectors, not "we can build that."
AI verification. Ask who signs off on a generated summary. Pass: a role and a workflow, not a disclaimer.
🔍 Review patterns that predict rollout pain
Read the one-and-two-star reviews before you read the case studies. Four failure signatures repeat.
"Extremely slow performance, especially when switching between segments. Exporting data loses all customisations and filters." Verified User, 24 Jun 2025Aviso G2 Verified Review
"Analytics/metrics are faulty like email opens... A handful of features don't work properly (inbound calls, task reminders, data connectivity between apps (CRM, Sales Nav)." Verified User, 26 Mar 2025Salesloft G2 Verified Review
Broken exports, faulty metrics, sync drops, and missing custom reports. Any one of these turns a signed contract into shelfware, which is why reading verified reviews beats reading case studies.
⏰ The training-time question nobody asks
Ask this directly: how many real meetings before the tool understands our sales methodology? Vague answers mean months of tuning.
Oliv AI needs three meetings to learn a team's methodology, and reviewers report full setup in five to fifteen minutes with an engineer on the call. I would still budget two to four weeks for full customization, because deep configuration is genuinely slower than onboarding, as any implementation timeline comparison shows.
🧪 The activity-capture bug worth reproducing
If you evaluate native CRM activity capture, test the exclusion rules with your real email traffic. Some systems flag an email as containing sensitive information when it plainly does not, a pattern documented in Salesforce Einstein reviews.
The email silently drops out of the record. You do not notice until a QBR, when the customer picture has holes nobody can explain.
🎯 Where this category is going
Here is the number that should shape your evaluation. 87% of enterprises missed 2025 revenue targets despite record AI investment. Spend was not the constraint.
Revenue orchestration is already old. What I think replaces it is revenue engineering: you stop coordinating humans around dashboards and start designing systems that produce the outcome. The distinction is simple. A vending machine gives fixed output for fixed input. An agent takes a goal and pursues it, which is the whole argument behind the move from RevOps to intelligence to orchestration.
Oliv AI runs agents across pipeline, sales, retention, and upsell for 100+ revenue teams, and reviewers describe CRM records updating automatically after every call. What I am still sitting with is whether managers will trust an agent's forecast before they trust their own spreadsheet, or only after a quarter of being right. If you have run that experiment on your own team, I would genuinely like to hear which way it went.
Q1. What are the 10 best revenue reporting software tools for revenue teams in 2026? [toc=1. Best Tools Compared]
The best revenue reporting software in 2026 splits into tools you read and tools that act. Oliv AI leads for agentic reporting, where an Analyst agent answers plain-English revenue questions and a one-page brief lands in your inbox Monday. Clari and Terret lead forecast dashboards, Anaplan for finance modeling, Gong for conversation data, Salesforce for native CRM reporting.
📊 The Thursday problem nobody puts on a slide
Every Thursday and Friday, managers sit with reps for one to two hours each. They reconstruct what moved, what slipped, and what to commit. Then they hand-build the report they present Monday.
That is not reporting. That is manual data archaeology with a chart on top. I have watched RevOps leads spend more time assembling the forecast than acting on it.
🧩 Read-versus-act: the only split that matters now
Most tools on this list are excellent at the read layer. They collect data, calculate metrics, and render dashboards. Then they stop and hand the work back to you.
The act layer is different. An agent reads the same data, writes the summary, updates the CRM field, and flags the deal without being asked. Oliv AI operates in that act layer, with agents like Analyst, Deal Driver, and CRM Manager running across the revenue orchestration workflow.
The three-layer cake I use to evaluate any reporting tool:
Layer 1, baseline data collection. Recording, transcription, and activity capture. This should be close to free in 2026.
Layer 2, intelligence. Language models tracking qualification fields like MEDDIC and MEDDPICC or BANT against real conversations.
Layer 3, agent. Proactive one-pagers pushed to leadership, plus writeback to the system of record.
Most platforms here stop cleanly at layer two. That is the whole story of this category.
The 10 best revenue reporting software tools in 2026
Oliv AI, best for agentic reporting and automated executive summaries
Anaplan, best for finance-grade revenue modeling and scenario planning
Aviso, best for AI forecast scoring in enterprise sales orgs
Clari, best for pipeline inspection and forecast roll-ups
Forecastio, best for HubSpot-native sales performance reporting
Gong, best for conversation data and Revenue Analytics dashboards
InsightSquared, best for prebuilt sales analytics report libraries
People.ai, best for activity capture and account-relationship data
Revenue Grid, best for guided-selling signals and Salesforce sync
Salesforce, best for native CRM reports when you already own the license
Salesloft, best for engagement and cadence analytics
Terret (formerly BoostUp), best for configurable revenue-command dashboards
Master comparison table
Revenue Reporting Software Compared Across Four Artifacts (2026)
Tool
Dashboards
Custom reports
Attribution views
Executive summaries
CRM writeback
Pricing signal
Rating
Oliv AI
✅ Agent-generated
✅ Spreadsheet-like analysis
✅ Deal-to-source context
✅ Automated one-pagers
✅ Auto-updates after every call
From $19/user/month
⭐⭐⭐⭐⭐
Anaplan
✅ Highly configurable
✅ Model-driven
⚠️ Planning-led, not funnel-led
⚠️ Manual build
❌ Not a CRM sync tool
Enterprise licensing, cited as expensive
⭐⭐⭐
Aviso
✅ Forecast views
⚠️ Exports lose filters
⚠️ Limited
⚠️ Manual
⚠️ SFDC sync issues reported
Enterprise, quote-based
⭐⭐
Clari
✅ Strong out-of-box
❌ "No custom reporting"
⚠️ Limited
⚠️ Manual
❌ "CRM writeback is not good"
Enterprise, quote-based
⭐⭐⭐
Forecastio
✅ HubSpot-native
✅ Sales performance reports
⚠️ Pipeline-source level
⚠️ Partial
✅ HubSpot-native
SMB-friendly tiers
⭐⭐⭐
Gong
✅ Revenue Analytics
✅ Data Studio metrics
⚠️ Conversation-weighted
✅ AI briefs
⚠️ Export limits reported
Enterprise, seat pricing visible in admin
⭐⭐⭐⭐
InsightSquared
✅ Prebuilt library
✅ Report builder
⚠️ Limited
⚠️ Manual
⚠️ Sync-dependent
Mid-market tiers
⭐⭐⭐
People.ai
✅ Activity dashboards
✅ Account reports
✅ Contact-to-opportunity mapping
⚠️ Partial
✅ Activity writeback
Enterprise, quote-based
⭐⭐⭐
Revenue Grid
✅ Signal dashboards
✅ Configurable
⚠️ Limited
⚠️ Partial
✅ Salesforce sync
Mid-market tiers
⭐⭐⭐
Salesforce
✅ Native reports
✅ Report builder
⚠️ Needs add-ons
❌ Manual
✅ Native
Per-seat, plus agent action credits
⭐⭐⭐
Salesloft
✅ Cadence analytics
⚠️ Faulty metrics reported
❌ Engagement-only
❌ Manual
⚠️ Connectivity issues reported
Per-seat tiers
⭐⭐
Terret (BoostUp)
✅ Command-center views
✅ Configurable
⚠️ Partial
⚠️ Partial
✅ CRM sync
Enterprise, quote-based
⭐⭐⭐
Ratings follow the weighted rubric in the next section. They are not popularity scores.
1.1 Oliv AI [toc=1.1 Oliv AI]
Oliv's orchestration diagram shows Oliver updating playbooks and syncing agents like Forecaster, Pipeline Tracker, and Analyst, keeping process changes reflected across every downstream report and revenue dashboard.
Oliv AI is an AI-native revenue intelligence platform where reporting is produced by agents rather than assembled by people. Founded in 2023 in San Francisco and backed by a $5M Foundation Capital seed, it now serves 100+ revenue teams.
⚙️ What it actually does
The reporting stack runs on named agents. The Analyst agent answers ad-hoc revenue questions on demand. The Deal Driver agent watches every open deal and flags risk. The CRM Manager agent writes fields back after each call.
Underneath sits the Context Graph, an intelligence layer that combines CRM object association with 100+ revenue-specific language models and a Process Graph encoding how your company sells.
🔑 Key features for reporting
Automated executive summaries. One-page briefs delivered without a manual roll-up, which is the Monday artifact managers currently hand-build.
Spreadsheet-like analysis. RevOps teams can query and slice revenue data directly, instead of writing custom code against a reporting API.
Custom methodology fields. Reviewers report filling out custom frameworks like MEDIC-BAND automatically from call content.
Forecast agent. Prepares weekly and monthly forecasts rather than waiting for a human to compile them, which is the core of any AI sales forecasting software evaluation.
CRM writeback. Automatic post-call updates to Salesforce, HubSpot, and Zoho, across 70+ integrations.
💰 Pricing and implementation
Pricing starts at $19 per user per month for the notetaker entry tier, with agents added one at a time rather than bought as a suite on day one. That matters if your budget is already committed elsewhere.
Setup is fast in practice. One reviewer describes a five-to-fifteen-minute configuration. Another describes forward-deployed engineers finishing a full rollout in under a week.
✅ Pros and ❌ cons
✅ Reporting is generated and acted on, not just displayed
✅ Automatic CRM updates after every call, verified in multiple G2 reviews
✅ Entry pricing at $19/user/month with modular agent expansion
✅ Fast deployment, reported in days rather than quarters
❌ Dashboard and analytics customization is the most common request in Oliv's own reviews
❌ Reviewers report occasional slowness and a basic mobile app
❌ Not the right fit for pure call-recording use cases or teams unwilling to let agents act
🗣️ Real user feedback
"The Analyst agent allows me to understand everything I need with just one click, eliminating the long wait time I used to have with RevOps to get answers. The Driver agent watches all my deals and flags any that are at risk, so I don't have to spend hours listening to recordings in tools like Gong and Clari." Verified User, 17 Jun 2026Oliv AI G2 Verified Review
"I'd love to see few more options to customize dashboards and reports for different teams." Verified User, 26 Jun 2026Oliv AI G2 Verified Review
"The main downside is that the analytics could be more customizable. It's a minor issue, but having more flexibility in how I view and configure analytics would make it even better." Verified User, 8 Jul 2026Oliv AI G2 Verified Review
I want to be honest about that second and third quote. The dashboard-customization gap is real, and it is the predictable trade-off of an agent-first design. Oliv AI's bet is that a delivered one-pager beats a configurable chart nobody opens, though I might be weighting that preference more heavily than a BI-minded RevOps lead would.
🎯 Best use case
A 25-to-200-rep mid-market B2B team where managers still hand-build the Monday forecast, and where CRM hygiene is the root cause of bad reporting.
Oliv AI's reporting layer is an agent, not a dashboard: the Analyst agent answers ad-hoc revenue questions and the forecast agent ships weekly and monthly roll-ups without a manual scrub.
1.2 Anaplan [toc=1.2 Anaplan]
Anaplan's GTM planning dashboard models customer tiers, bookings targets, and renewal assumptions, connecting sales and finance data into unified revenue reporting for defensible, AI-driven forecasts and executive summaries.
Anaplan is a connected-planning platform used for finance-grade revenue modeling, scenario analysis, and variance reporting. It is the right pick when your reporting question is "what happens to revenue if we change three assumptions," not "which deal is at risk."
🧮 What it actually does
Anaplan builds multidimensional models where a single variable change updates the entire dataset and every dashboard built on it. Reviewers use it for forecasting, sales projections, resource planning, and aging reports.
Its scope has widened beyond finance into sales, supply chain, retail, and workforce planning. Financial Close and Consolidation solutions were added recently, plus prebuilt applications that reviewers say cut implementation by two to three weeks.
🔑 Key features for reporting
Variable-driven dashboards. Update one risk factor and the full dataset and visual layer recalculate together.
Dynamic scenario and variance analysis. Run in-app, without exporting to a separate BI tool.
Low-code model building. Business users can maintain models after the initial implementation.
Prebuilt planning applications. Shorten deployment for standard finance use cases.
📅 Anaplan reporting capability, then and now
Anaplan Product Update Timeline for Revenue Reporting
Period
What was in the product
Through 2025
Connected planning across finance, sales, supply chain, retail, and workforce, with dashboard reporting, scenario and variance analysis, and low-code model building maintained by business users, per verified G2 reviewer detail
Late 2025 into 2026
Financial Close and Consolidation solutions added, prebuilt applications reducing implementation by two to three weeks, and improved third-party integration via ADO for faster multi-source data pulls, per verified G2 reviewer detail
Expected next
Reviewers point to continued expansion of AI and generative features, currently described as costly with narrow use cases, alongside pressure to improve large-dataset performance and Excel-based ad-hoc analysis, per verified G2 reviewer detail
💰 Pricing and implementation
Anaplan uses enterprise licensing without public list pricing. Reviewers consistently flag the cost, describing an expensive licensing model where scalability "comes at a significant expense".
Implementation is a project, not a setup. Prebuilt apps help, but expect a modeling exercise with a partner or an internal Anaplan-certified builder.
✅ Pros and ❌ cons
✅ Best-in-class scenario modeling and variance analysis for revenue planning
✅ One variable change cascades through the full dataset and dashboards
✅ Low-code maintenance after go-live, plus responsive support
❌ Limited API makes real-time syncing to warehouses like Snowflake difficult, so reviewers schedule batch syncs instead
❌ Performance degrades on large datasets, and licensing is repeatedly called expensive
❌ Ad-hoc Excel analysis is weaker than rival EPM tools, forcing work back into the application
❌ Role-based access described as inflexible, pushing teams to over-assign admin roles
🗣️ Real user feedback
"Anaplan does not integrate seamlessly with third party platforms given its limited API. Therefore, it is difficult to sync data between Anaplan and our Snowflake data warehouse in real-time." Verified User, 3 Jun 2025Anaplan G2 Verified Review
"I think role-based access could use an improvement. It wasn't very flexible at the time I was using it. Everyone used to have access to the same dataset." Verified User, 14 Jan 2026Anaplan G2 Verified Review
"Anaplan has consistently faced challenges due to its expensive licensing model and performance limitations when handling large datasets. The basic AI and Gen AI features are not only costly but also have a very limited user base." Verified User, 9 Nov 2025Anaplan G2 Verified Review
🎯 Best use case
A finance-led revenue reporting mandate at enterprise scale, where modeling depth matters more than deal-level action, and where a dedicated planning team already exists.
Oliv AI takes the opposite position on the same problem: instead of modeling revenue in a planning layer, its agents work inside the CRM your reps already use, so the reported number and the recorded number stay the same.
1.3 Aviso [toc=1.3 Aviso]
Aviso's revenue cycle view layers forecast, pipeline, and rep activity snapshots with account engagement trends, showing how revenue reporting software turns scattered deal data into faster decisions.
Aviso is an AI forecasting platform used mainly by enterprise sales orgs that want a predicted number alongside the rep-submitted one. On reporting specifically, it is the weakest performer in this list based on verified reviews.
🔍 What it actually does
Aviso ingests CRM data and produces AI forecast scores, segment roll-ups, and rep-level views. Managers filter by owner name to prep one-on-ones and forecast calls.
The core promise is a second opinion on the forecast. The reporting layer around it is where reviewers report friction.
🔑 Key features for reporting
Left-hand group filters. Filter by owner or segment to isolate one rep before a forecast call.
AI forecast scoring. A predicted number sits next to the submitted number.
Segment roll-ups. Views by team, region, or hierarchy.
SFDC sync. Data flows from Salesforce, though reviewers report reliability gaps.
💰 Pricing and implementation
Aviso sells enterprise contracts with quote-based pricing. No public list price exists.
Implementation depends heavily on internal enablement. One reviewer describes adoption with "no internal support or training provided," which is a rollout problem as much as a product one.
✅ Pros and ❌ cons
✅ Owner-level filtering makes one-on-one prep straightforward
✅ AI-generated forecast scores give managers a challenge number
❌ Exporting data "loses all customisations and filters," which breaks custom reporting workflows
❌ Reviewers report slow performance when switching between segments
❌ SFDC sync failures and update lag reported, forcing Excel workarounds
❌ Analytics described as ineffective by multiple reviewers
🗣️ Real user feedback
"Extremely slow performance, especially when switching between segments. Exporting data loses all customisations and filters. Analytics are ineffective and add no real value." Verified User, 24 Jun 2025Aviso G2 Verified Review
"The solution is slow, often times it doesn't sync with SFDC, the reports are terrible and don't represent what is being pulled by the data." Verified User, 18 Feb 2025Aviso G2 Verified Review
"I like being able to filter by group on the left-hand side. I often filter by the owner name so that I can easily zero in on one individual when I'm doing a one-on-one or through my forecast call." Verified User, 8 Dec 2025Aviso G2 Verified Review
That export complaint is the one I would test in a demo. A report that loses its filters on export is not a report. It is a screenshot with extra steps.
🎯 Best use case
A large enterprise that already mandates a second forecast opinion and has an internal enablement team ready to support the rollout.
Oliv AI approaches the same forecast-call problem differently: its forecast agent prepares the weekly and monthly roll-up before the call, so managers review a number rather than rebuild one.
1.4 Clari [toc=1.4 Clari]
Clari's Revenue Context page pairs a seller with AI prompts for quarterly predictions, coaching, and daily focus, illustrating agent-generated insights that feed executive revenue reporting and analytics views.
Clari is the category-defining pipeline inspection and forecast platform. It is pre-generative AI in architecture, built to show you the pipeline rather than act on it, and its feature set reflects that origin.
📈 What it actually does
Clari pulls Salesforce data into forecast views, inspection views, and waterfall analysis. Reviewers use it instead of native Salesforce forecasting because the roll-up happens automatically.
It has since expanded into cadences, dialing, and conversation intelligence. Reviewers say the newer layers are less mature than the forecasting core.
🔑 Key features for reporting
Out-of-the-box dashboards. Strong prebuilt analytics with minimal configuration.
Weekly forecast and opportunity analysis. Week-over-week drill-down into individual deals.
Flow View and Waterfall View. Pipeline movement analysis, though reviewers report both underperforming.
Inspection View presets. Standardizing the display still takes extra work.
Email engagement tracking. Open and receipt signals feed deal-strength reads.
💰 Pricing and implementation
Clari uses enterprise quote-based pricing with no public list rate. For a 25-to-200-rep team, stacking Clari with Gong and Salesloft is how total cost quietly clears $500 per user per month, which is why the Clari alternatives conversation keeps coming up.
✅ Forecasting is simple, fast, and well integrated with Salesforce
✅ Out-of-the-box dashboards and cadence analytics are genuinely robust
✅ Smooth implementation reported repeatedly
❌ "There's no custom reporting," per a July 2026 reviewer
❌ CRM writeback described as "not good," with MEDDIC values unable to return to Salesforce
❌ AI features called immature, with weak integration to non-Salesforce systems
❌ Connection drops with Salesforce, Gmail, and calendar require app restarts
🗣️ Real user feedback
"There's no custom reporting. The CRM writeback is not good; we cannot send MEDDIC values back to Salesforce or update fields in Salesforce from the conversation intelligence. The AI is not as flexible as we need it to be." Verified User, 13 Jul 2026Clari G2 Verified Review
"The AI features are immature, team activity is poorly designed, and it doesn't integrate well with other popular business systems today." Verified User, 10 Oct 2025Clari G2 Verified Review
"I'm concerned that the advanced 'Flow View' and 'Waterfall View' aren't working well. I also find it inconvenient that it still takes extra work to get the 'Inspection View' display standardized using presets." Verified User, 16 Nov 2025Clari G2 Verified Review
Read that first quote again. Two of the four artifacts this article is about, custom reports and writeback, are named as gaps by a paying user.
🎯 Best use case
A Salesforce-standardized enterprise where forecast roll-up speed matters more than custom reporting or field-level writeback.
Oliv AI closes exactly the loop Clari reviewers flag: its CRM Manager agent writes methodology fields, including custom frameworks like MEDIC-BAND, back into Salesforce and HubSpot after each call.
1.5 Forecastio [toc=1.5 Forecastio]
Forecastio is a HubSpot-native sales performance and forecasting tool built for smaller revenue teams. It is the pragmatic pick when Clari and Anaplan are overbuilt for your headcount.
🧭 What it actually does
Forecastio sits directly on HubSpot data and produces forecasts, performance reports, and goal tracking. There is no separate data pipeline to maintain.
It targets sales leaders at 10-to-100-rep companies who need reporting rigor without a RevOps hire.
🔑 Key features for reporting
HubSpot-native sync. No middleware, no warehouse dependency.
Sales performance reporting. Conversion, velocity, and win-rate views by rep and stage.
Goal and quota tracking. Attainment views tied to plan.
Scenario-light forecasting. Simpler than a planning platform, faster to configure.
💰 Pricing and implementation
Forecastio publishes SMB-friendly tiers well below enterprise revenue platforms. Deployment is measured in hours because the CRM is the data source.
✅ Pros and ❌ cons
✅ Native HubSpot data model, so numbers match the CRM
✅ Affordable relative to enterprise revenue platforms
✅ Fast to deploy without a RevOps team
❌ HubSpot-only, so Salesforce shops are excluded
❌ No conversation data, so pipeline reads stay CRM-dependent
❌ Reporting depth is thinner than dedicated analytics platforms
🎯 Best use case
A HubSpot-based team under 100 reps that needs credible forecast reporting and cannot justify enterprise licensing.
Oliv AI serves the same HubSpot-first buyer at a similar entry point, starting at $19 per user per month, with agents added one at a time rather than as a suite.
1.6 Gong [toc=1.6 Gong]
Gong is the conversation-intelligence platform that became a Revenue AI Operating System. It has the deepest data set on this list and, per reviewers, the tightest grip on it, which is why buyers keep researching Gong alternatives.
🎙️ What it actually does
Gong records, transcribes, and analyzes calls, then layers dashboards, forecast boards, and AI briefs on top. Founded in 2015, its conversation-intelligence core is still the center of the product.
Reporting arrived properly in October 2024 with Revenue Analytics, described as "robust, configurable, and dynamic dashboards."
Configurable forecast boards. Spreadsheet-like boards covering new business, renewals, upsells, and net revenue, shipped November 2025.
AI briefs. Customizable summaries at homepage, deal, account, and call level, shipped May 2025.
Data Extractor. Extracts AI fields from conversations and maps them to CRM, shipped December 2025.
Data Studio metrics. Metrics built on related object fields, added May 2026.
📅 Gong reporting capability, then and now
Gong Reporting Product Updates, 2025 to 2026
Period
What shipped
Through 2025
Revenue Analytics dashboards on custom metrics, AI briefs across deal, account, and call surfaces, Agent Studio for managing AI agents, and configurable spreadsheet-like forecast boards covering renewals and net revenue
Feb to May 2026
Mission Andromeda launched Gong Enable with conversational guidance and unified account management on 25 Feb 2026, followed by Snowflake multi-instance connectivity and Data Studio metrics built from related object fields
Expected next
Bidirectional Model Context Protocol support so the AI Briefer pulls third-party data into briefs and external AI platforms query Gong, plus brief generation via API across calls, contacts, accounts, and deals
💰 Pricing and implementation
Gong does not publish list pricing. Per-seat pricing became visible inside the admin center for eligible direct-purchase accounts in June 2025, and Gong Enable is a separate paid module, which complicates any Gong pricing comparison.
Reviewers describe setup friction, particularly around AI tracker configuration and real-time integrations.
✅ Pros and ❌ cons
✅ Deepest conversation data set, with strong AI theme detection across departments
✅ Genuinely configurable dashboards and forecast boards since late 2025
✅ Active shipping cadence, with monthly release notes and ARR past $500M as of May 2026
❌ "Limitations of getting data back into salesforce," per a May 2026 reviewer
❌ Full data download gated behind a plan upgrade, with snippets copied one by one
❌ AI tracker setup UI described as difficult
❌ Data is lost when you stop paying, per a March 2026 reviewer
🗣️ Real user feedback
"limitations of getting data back into salesforce" Verified User, 21 May 2026Gong G2 Verified Review
"I cannot download all the data myself unless we upgrade the plan, which isn't ideal and results in me not fully utilizing Gong. The requirement to download snippets one by one using copy and paste is particularly annoying." Verified User, 3 Oct 2025Gong G2 Verified Review
"The fact that you can't edit a recording (to only share a portion with a client), and the fact that if you stop working with the tool you lose the data." Verified User, 19 Mar 2026Gong G2 Verified Review
Oliv AI's read here goes against the usual Gong critique. The problem is not the analysis quality, which is strong. It is that RevOps teams write custom code to extract data for their own analysis, when what they need is a spreadsheet-like surface. I could be over-indexing on the teams that came to us specifically for that reason.
🎯 Best use case
An enterprise where conversation data is the strategic asset and a dedicated analytics team can work around export limits.
Oliv AI takes the opposite stance on data portability: its agents push structured deal data back into Salesforce, HubSpot, and Zoho as the default output, not as an upgrade tier.
1.7 InsightSquared [toc=1.7 InsightSquared]
InsightSquared is a sales analytics platform known for a large prebuilt report library. It is the right pick when you want reports that already exist rather than reports you have to build.
📚 What it actually does
InsightSquared connects to the CRM and delivers hundreds of prebuilt reports covering pipeline, activity, conversion, and forecast. A report builder handles the rest.
It grew up in the pre-generative-AI era, so the model is dashboard-and-drill-down rather than agent-and-action.
🔑 Key features for reporting
Prebuilt report library. Wide coverage without building from scratch.
Custom report builder. For metrics outside the standard set.
Activity and pipeline analytics. Rep-level and team-level views.
Forecast roll-ups. Submitted versus predicted comparisons.
💰 Pricing and implementation
Mid-market tiers, quote-based. Implementation depends on CRM data quality, which is the recurring theme across every tool in this category.
✅ Pros and ❌ cons
✅ Large prebuilt library shortens time to first report
❌ No conversation data, so reporting inherits CRM hygiene problems
❌ Attribution views are limited
❌ Executive summaries remain a manual build
🎯 Best use case
A mid-market sales org with clean CRM data that wants breadth of standard reporting fast.
Oliv AI attacks the upstream cause instead: its CRM Manager agent updates fields automatically after calls, so the reports built on top inherit accurate data.
1.8 People.ai [toc=1.8 People.ai]
People.ai is an activity-capture and account-intelligence platform. It answers "who did we actually talk to" better than anything else on this list.
🕸️ What it actually does
People.ai captures emails, meetings, and contacts, then maps them to accounts and opportunities. That relationship graph feeds coverage reports and engagement analysis.
For attribution work, this contact-to-opportunity mapping is genuinely useful. Most reporting tools cannot answer it at all.
🔑 Key features for reporting
Automated activity capture. Emails and meetings logged without rep effort.
Contact-to-opportunity mapping. Buying-group coverage per deal.
Account engagement dashboards. Multi-threading depth by account.
CRM activity writeback. Captured activity flows into the system of record.
💰 Pricing and implementation
Enterprise, quote-based. Deployment involves email and calendar permissioning, which is a security review, not a config change.
✅ Pros and ❌ cons
✅ Best-in-class activity capture and relationship mapping
✅ Contact-level attribution most reporting tools cannot produce
✅ Writes activity back to CRM automatically
❌ Not a forecast or executive-summary tool
❌ Value depends on broad email and calendar access approval
❌ Reporting is engagement-led, not revenue-recognition-led
🗣️ A note on activity capture
Activity capture tools break in a specific way I have watched repeatedly. Emails get flagged as sensitive and excluded, so the customer picture has holes nobody notices until a QBR.
An enterprise running multi-threaded deals where buying-group coverage is a reported metric.
Oliv AI treats activity capture as an input rather than the product: its Context Graph associates activity to the correct CRM object before agents act on it.
1.9 Revenue Grid [toc=1.9 Revenue Grid]
Revenue Grid is a guided-selling and Salesforce sync platform with signal-based dashboards. It targets teams that want nudges alongside numbers.
🚦 What it actually does
Revenue Grid monitors pipeline and generates signals when deals stall or steps get skipped. Reporting sits on top of that signal layer.
It is closer to the act layer than Clari or InsightSquared, though the actions are alerts rather than completed work.
🔑 Key features for reporting
Signal dashboards. Alerts on stalled deals and missed steps.
Configurable reports. Pipeline and activity views by team.
Mid-market tiers, quote-based, with a Salesforce-centric deployment.
✅ Pros and ❌ cons
✅ Signal engine surfaces risk without manual inspection
✅ Reliable Salesforce bidirectional sync
✅ Mid-market pricing
❌ Signals still hand the work back to a human to complete
❌ Attribution views limited
❌ Smaller review base than Clari or Gong, so evidence is thinner
🎯 Best use case
A Salesforce-based mid-market team that wants guided-selling nudges plus reporting in one contract.
Oliv AI's distinction here is narrow but real: instead of alerting a rep to update a field, its Deal Driver agent flags the risk and the CRM Manager agent completes the update.
1.10 Salesforce [toc=1.10 Salesforce]
Salesforce is the default revenue reporting tool for most companies because it is already paid for. Native reports and dashboards handle more than teams assume.
🏛️ What it actually does
Salesforce reports and dashboards run directly on your opportunity data. Report types, filters, and joined reports cover a wide range of revenue questions without any third-party tool.
Where it struggles is anything requiring conversation context, narrative summaries, or data your reps never entered.
🔑 Key features for reporting
Native report builder. Custom report types, filters, and joined reports.
Dashboards. Component-level charts on live opportunity data.
Forecasting module. Native roll-ups by hierarchy.
Einstein activity capture. Automated email and meeting logging, with known exclusion behavior.
Agentforce. Action-credit-priced agents layered on the platform, covered in detail in this Agentforce pricing breakdown.
💰 Pricing and implementation
Per-seat licensing you already pay, plus consumption pricing for agent actions. Action-credit models make monthly spend hard to predict as usage scales.
Implementation is admin work, not procurement. That is the real advantage.
✅ Pros and ❌ cons
✅ Zero incremental license cost for core reporting
✅ Native writeback because it is the system of record
✅ Deep customization through report types and formula fields
❌ Reports are only as good as what reps manually enter
❌ Executive summaries are entirely manual
❌ Activity capture exclusion rules create silent data gaps
❌ Agent action credits make spend unpredictable at volume
🎯 Best use case
Any team with disciplined CRM hygiene and a competent admin. Start here before buying anything, and buy only where Salesforce genuinely cannot answer the question.
Oliv AI is built on that premise: it plugs into Salesforce, HubSpot, and Zoho to make them accurate rather than asking teams to report somewhere else.
1.11 Salesloft [toc=1.11 Salesloft]
Salesloft is an engagement platform with cadence and activity analytics. On revenue reporting, it is the narrowest tool here, and reviewer sentiment on data reliability is poor.
📬 What it actually does
Salesloft sequences outreach and reports on engagement: opens, replies, calls, and cadence performance. Managers use it for top-of-funnel observability.
It reports activity, not revenue. That distinction matters when it appears on revenue reporting shortlists, and it shapes any Gong versus Salesloft evaluation.
🔑 Key features for reporting
Cadence analytics. Step-level performance across sequences.
Activity and dialer metrics. Call and email volume by rep.
Engagement tracking. Opens and replies, with reported accuracy issues.
CRM sync. Salesforce connectivity, with reported reliability gaps.
💰 Pricing and implementation
Per-seat tiers. Reviewers repeatedly describe difficult initial setup and a steep learning curve.
✅ Pros and ❌ cons
✅ Brings structure to high-volume outreach and follow-up
✅ Cadences and templates centralized in one place
❌ "Analytics/metrics are faulty like email opens," per a March 2025 reviewer
❌ Data connectivity issues between CRM, Sales Navigator, and the app
❌ Meeting logging problems reported, which corrupts activity reporting
❌ No conditional-logic automation, per a September 2025 reviewer
🗣️ Real user feedback
"Analytics/metrics are faulty like email opens... A handful of features don't work properly (inbound calls, task reminders, data connectivity between apps (CRM, Sales Nav)." Verified User, 26 Mar 2025Salesloft G2 Verified Review
"I often have trouble logging meetings, and certain features feel clunky or overly manual. The learning curve can be frustrating, especially when you're trying to move quickly in a fast-paced environment." Verified User, 22 Jul 2025Salesloft G2 Verified Review
"For months, randomly, one-off emails sent from Salesloft (not sequences) would appear blank in the recipient's mailbox... No automations based on conditional logic." Verified User, 24 Sep 2025Salesloft G2 Verified Review
If engagement metrics are unreliable at the source, every downstream report inherits the error. That is worth more scrutiny than any dashboard feature.
🎯 Best use case
An outbound-heavy team that needs cadence execution, with revenue reporting handled elsewhere.
Oliv AI is not an engagement platform, and pairing it with a sequencer is a reasonable stack. The difference is that Oliv's agents complete post-call work rather than reporting that it did not happen.
1.12 Terret (formerly BoostUp) [toc=1.12 Terret]
Terret, previously BoostUp, is a revenue command-center platform competing directly with Clari on configurable dashboards and forecast rigor.
🎛️ What it actually does
Terret unifies CRM, activity, and conversation data into configurable revenue views. The pitch is flexibility, positioned against Clari's more fixed structure.
For teams that hit Clari's custom-reporting wall, Terret is the usual next evaluation alongside other revenue orchestration platforms.
🔑 Key features for reporting
Configurable command-center dashboards. Built around your metric definitions.
Forecast submission and roll-up. Multi-level hierarchy support.
Conversation and activity signals. Feeding deal-health views.
CRM sync. Bidirectional with Salesforce.
💰 Pricing and implementation
Enterprise, quote-based. Implementation is a configuration project because flexibility is the product.
✅ Pros and ❌ cons
✅ More configurable reporting than Clari's out-of-the-box structure
✅ Multi-stream forecasting including renewals
✅ CRM sync in both directions
❌ Configuration effort is the cost of that flexibility
❌ Attribution views remain partial
❌ Smaller review base than Clari or Gong, so buyer evidence is thinner
❌ Executive summaries still require assembly
🎯 Best use case
An enterprise RevOps team with the capacity to configure its own metric definitions and a specific complaint about a rigid incumbent.
Oliv AI's read is that configurability is the wrong axis for most mid-market teams. We see managers who do not want a better report builder. They want the Monday one-pager already written, which is what the forecast agent delivers.
Which profile picks which tool
Buyer Profile to Tool Match for Revenue Reporting
Your situation
Start with
Managers hand-build the Monday forecast
Oliv AI, agent-generated briefs plus CRM writeback
Finance owns revenue modeling at enterprise scale
Anaplan, despite licensing cost
Salesforce-standardized, forecast speed over custom reports
Clari
Conversation data is the strategic asset
Gong
HubSpot shop under 100 reps
Forecastio
Buying-group coverage is a reported metric
People.ai
CRM hygiene is already strong and budget is zero
Salesforce native reports
Oliv AI sits at position one for a narrow reason worth stating plainly: across this list, reviewers name custom reporting and CRM writeback as the two most common gaps, and Oliv's agents are built to close both.
Q2. How did we score and select these revenue reporting tools? [toc=2. Scoring Methodology]
Every tool was scored out of 100 across five criteria: Reporting Depth and Custom Report Flexibility (25%), Agentic Action versus Dashboard-Only (25%), Attribution and Cross-Functional Data Coverage (20%), Setup and Time-to-First-Report (15%), and Pricing Transparency (15%). Scores of 0 to 20 earn one star, 21 to 40 two, 41 to 60 three, 61 to 80 four, and 81 to 100 five.
⭐ Why these five weights, and not popularity
Reporting depth and agentic action carry equal top weight for one reason. A tool that shows you a number and a tool that writes the report are doing different jobs at different costs.
Attribution sits at 20% because it is the rarest capability in this category. Setup time and pricing transparency split the last 30%, since both decide whether the tool actually gets used.
🔬 How each criterion was evidenced
Three evidence types only. Verified G2 reviews from the last 24 months, vendor documentation and release notes, and hands-on setup timing.
No vendor marketing claims were scored. When a vendor said "robust reporting" and a reviewer said "there's no custom reporting," the reviewer won. G2's Revenue Operations and Intelligence category, built on thousands of verified reviews, was the base pool for this survey of revenue intelligence software platforms.
⚖️ How to re-weight this for your own context
The weights above assume a mid-market B2B SaaS buyer. Shift them if your situation differs.
Under 50 reps: raise Setup and Pricing Transparency to 40% combined, and drop Attribution to 10%.
Complex revenue model (usage-based, multi-entity): raise Reporting Depth to 35%.
Real ASC 606 exposure: add a pass/fail compliance gate before scoring anything.
Enterprise with a RevOps team: raise Attribution, since you have the people to use it.
📉 The metric trap that skews most rubrics
Activity metrics with no link to deal advancement are hollow. Call counts and email volume look like reporting, but they predict nothing.
I score any tool down when its headline dashboard is activity volume. Glorified scorekeepers make poor forecasters, and that is true of software as much as managers.
🧮 The 10/80/10 test applied to tools
Oliv AI's evaluation frame is the 10/80/10 rule: you spend 10% defining the reporting outcome, the tool does 80% of the lifting, and you spend 10% on a quality check. Any platform demanding 80% human effort loses points, no matter how good the charts look.
⭐ Final scores across all twelve tools
Revenue Reporting Software Scores Out of 100 (2026)
Tool
Score
Stars
Where it lost points
Oliv AI
88
⭐⭐⭐⭐⭐
Dashboard customization, flagged in its own reviews
Gong
74
⭐⭐⭐⭐
Export gating and Salesforce writeback limits
Clari
62
⭐⭐⭐
No custom reporting, weak CRM writeback
Terret (BoostUp)
60
⭐⭐⭐
Configuration effort, thin buyer evidence
Anaplan
58
⭐⭐⭐
Limited API, costly licensing, and large-dataset lag
People.ai
57
⭐⭐⭐
Not a forecast or summary tool
Salesforce
55
⭐⭐⭐
Manual summaries, unpredictable agent credits
Forecastio
54
⭐⭐⭐
HubSpot-only, no conversation data
Revenue Grid
52
⭐⭐⭐
Alerts stop short of completing work
InsightSquared
50
⭐⭐⭐
No conversation layer, limited attribution
Aviso
34
⭐⭐
Exports lose filters, SFDC sync failures
Salesloft
30
⭐⭐
Faulty engagement metrics at the source
🗣️ What reviewers said that moved scores
"There's no custom reporting. The CRM writeback is not good." Verified User, 13 Jul 2026Clari G2 Verified Review
"Additionally, setting up Oliv.ai was straightforward and could be done in just five to fifteen minutes." Verified User, 15 Jun 2026Oliv AI G2 Verified Review
"Extremely slow performance, especially when switching between segments. Exporting data loses all customisations and filters." Verified User, 24 Jun 2025Aviso G2 Verified Review
Oliv AI scores 88 on this rubric: setup timed at 5 to 15 minutes by reviewers, entry pricing at $19 per user per month, and an agent layer that completes work instead of returning it. The 12 points it loses are dashboard customization, and that gap is named by its own users.
Q3. What is revenue reporting software, and which category do you actually need? [toc=3. Definitions and Categories]
Revenue reporting software unifies CRM, billing, and warehouse data to produce dashboards, custom reports, attribution views, and executive summaries. Recognition software governs when revenue may be booked under ASC 606 and IFRS 15. Intelligence software predicts pipeline outcomes. Reporting explains what happened and why, recognition governs what you may book, and intelligence forecasts what comes next.
🧾 Three categories the market keeps confusing
These three get sold as one thing. They are not.
Revenue Reporting vs Recognition vs Intelligence
Dimension
Reporting
Recognition
Intelligence
Core question
What happened, and why
What may we book, and when
What happens next
Owner
RevOps, sales leadership
Finance, controller
Sales leadership, RevOps
Output
Dashboards, reports, summaries
Deferred schedules, audit trail
Forecasts, risk scores
Standard
Internal metric definitions
ASC 606, IFRS 15
Model accuracy
Example tool
Oliv AI, Clari, Gong
ERP revenue modules
Aviso, Clari
💰 One contract, three different answers
Take a $1,200 annual SaaS contract signed in January. Reporting tells you it came from a partner referral and closed in 34 days.
Recognition spreads it as $100 per month across twelve months. Intelligence flags in month nine that usage dropped and renewal is at risk. Same contract, three separate systems, three different jobs.
🗂️ The six categories, and who each fits
CRM-based tracking. Native Salesforce or HubSpot reports. Fits teams with clean data and no budget.
Accounting suite reporting. QuickBooks or Xero reports. Fits companies under $10M with simple revenue.
Subscription billing analytics. Stripe, Chargebee, and Maxio. Fits recurring or usage-based models.
Dedicated revenue automation. Oliv AI, Clari, Gong, and Terret. Fits mid-market and enterprise teams where reporting must drive action, which is the core promise of revenue orchestration platforms.
ERP revenue modules. NetSuite, SAP, and Oracle. Fits multi-entity companies with real compliance exposure.
General BI layer. Tableau, Power BI, and Qlik. Fits teams with a data engineer and a warehouse.
🧪 Two decision tests before you buy
The BI-is-enough test. If you already have a warehouse, a data engineer, and stable metric definitions, a BI tool is enough. Buy a revenue platform only when nobody owns the definitions or the reports arrive too late to act on.
The ERP-sufficiency test. Your ERP is enough when revenue is contract-based and predictable, and finance is the only consumer of the report. Add a dedicated platform when revenue is usage-based or when sales leadership needs attribution and narrative summaries the ERP cannot produce.
⚠️ The compliance gate that ends shortlists early
If you have real ASC 606 or IFRS 15 exposure, this is a pass/fail check, not a scoring criterion. Four requirements, all non-negotiable.
Contract-level deferred revenue schedules, not aggregate journal entries.
Automatic adjustments for upgrades, downgrades, and cancellations mid-term.
Multi-currency and multi-entity consolidation.
An exportable audit trail an external auditor can trace to the source transaction.
🏛️ The dumb-repository problem
Running a revenue org on a system reps update only because management demands it is not reporting. It is compliance theatre with charts attached.
The honest test is simple. If your reps stopped updating the CRM tomorrow, how much of your reporting would survive? For most teams, the answer is almost none, which tells you the reporting tool was never the problem, and it explains why the shift from RevOps to intelligence to orchestration keeps stalling.
Oliv AI operates in the reporting and action layer, plugging into Salesforce, HubSpot, and Zoho rather than replacing them, so recognition stays in finance's system of record. That split matters: agents make the CRM accurate, and the controller keeps control of the ledger.
Q4. Why do dashboards keep failing sales managers on Monday morning? [toc=4. The Dashboard Failure]
Dashboards fail because they shift the analysis onto the manager. Every Thursday and Friday, managers spend one to two hours per rep reconstructing pipeline movement, then hand-build Monday's report. Meanwhile 55% of sales leaders lack high confidence in their forecast. The fix is not another tile. It is a one-page brief that arrives already reasoned.
⏰ What the Thursday scrub actually costs
Picture a manager with eight reps. Thursday and Friday go to one-on-ones, one to two hours each, reconstructing what moved and why.
That is 8 to 16 hours a week spent assembling a number, not improving it. The dashboard did not save that time. It created it, by presenting data that still needs a human to interpret.
🚿 Senior time spent digging, not deciding
The habit I see most is managers listening to call recordings while driving and reading dashboards in odd gaps of the day. They are doing manual data archaeology on their own time, and it is the pattern that pushes teams toward AI for sales calls in the first place.
That is the most expensive labor in the org, spent on the least leveraged task. Nobody puts it on a slide because it does not look like a problem. It looks like diligence.
🔄 The twist: reconciliation, not visualization
Here is where the standard advice gets it backwards. Everyone treats bad reporting as a visualization problem, so they add a tool.
Each added tool makes the stack more brittle, not more resilient. Around a third of finance leaders name revenue recognition and reconciliation as the hardest processes to scale. Board numbers break at the join between systems, not at the chart.
📈 The accuracy ladder is coachable
Forecast accuracy is not a chart feature. It is a ladder you climb with process discipline, and it is the real benchmark for any AI sales forecasting software.
Below 70%: pipeline visibility or stage definitions are broken.
70 to 85%: where most B2B SaaS teams sit today.
90 to 95%: top-performer range, meaning actuals land within 10% of forecast.
96% by week two: the vendor-claimed upper bound, useful as a reference point, not a promise.
Only 41% of sales managers and executives are satisfied with their current dashboards for decision-making. That is not a design complaint. It is a job-allocation complaint.
📄 The design target: one page, already reasoned
The artifact worth building toward is narrow. You sit down Monday morning, and a one-page document is already in your inbox, focused on the top five to ten deals that actually matter.
Not 40 tiles. Not a drill-down path. A brief that has already done the reasoning, with the source numbers traceable underneath.
✅ The tactic to run this week
Before you evaluate a single tool, run this in your next pipeline review. If a rep cannot articulate the exact status of a deal, push it off the forecast.
No debate, no split commit. This one rule surfaces more forecast error in a week than a new dashboard will in a quarter, and it costs nothing. Pair it with a qualification framework like MEDDIC so "exact status" means something specific.
Oliv AI was built against this exact workflow: its forecast agent assembles the weekly and monthly roll-ups, so the Thursday scrub becomes a review instead of a reconstruction. One reviewer reports forecast accuracy up 27% after the switch, which I read as process discipline finally being enforced by software rather than by memory.
Q5. Dashboards, custom reports, attribution views, or executive summaries: which one actually moves revenue? [toc=5. Four Reporting Artifacts]
Treat them as four separate jobs. Dashboards monitor, custom reports investigate, attribution views assign credit, and executive summaries narrate. Most platforms are strong on one and weak on three. Ask each vendor to build a custom report live, then ask who verifies the narrative before leadership reads it. That test separates the shortlist fast.
📊 The four artifacts, and the job each one holds
Every buyer says they want "better reporting." Push on it, and four different requests fall out.
Dashboards answer "is anything off?" You glance at them daily.
Custom reports answer "why is that off?" You build them when something looks wrong.
Attribution views answer "what should we fund next?" They connect source to closed revenue.
Executive summaries answer "what do I tell the board?" They need reasoning, not tiles.
❌ Where the market actually breaks
Across verified G2 reviews from the last 24 months, two gaps repeat more than any others. Custom reporting and CRM writeback.
"There's no custom reporting. The CRM writeback is not good; we cannot send MEDDIC values back to Salesforce or update fields in Salesforce from the conversation intelligence." Verified User, 13 Jul 2026Clari G2 Verified Review
"limitations of getting data back into salesforce" Verified User, 21 May 2026Gong G2 Verified Review
Two different platforms, two different price points, the same structural gap. It is the recurring complaint that drives buyers toward Gong alternatives and rival forecast tools alike.
🔗 Attribution is the near-absent capability
Attribution is the rarest of the four. Most tools stop at pipeline source and never reach recognized revenue.
The reason is a missing join key. You need a single identifier that survives the trip from lead source, through opportunity, into the billing record, and out to recognized revenue. Without it, marketing reports pipeline, finance reports revenue, and the two numbers never reconcile.
🧑⚖️ Executive summaries need a named human verifier
Adoption is not the question anymore. 87% of sales organizations already use some form of AI, and 94% of sales leaders with agents call them critical to meeting business demands.
That makes governance the question. Every AI-written summary that reaches leadership needs one named person who verifies it. Not a policy document, a name.
⭐ Capability grid across the shortlist
Four Reporting Artifacts Compared Across Platforms
Tool
Dashboards
Custom reports
Attribution
Exec summaries
Oliv AI
⭐⭐⭐
⭐⭐⭐⭐
⭐⭐⭐⭐
⭐⭐⭐⭐⭐
Gong
⭐⭐⭐⭐
⭐⭐⭐⭐
⭐⭐⭐
⭐⭐⭐⭐
Clari
⭐⭐⭐⭐
⭐
⭐⭐
⭐⭐
Aviso
⭐⭐
⭐
⭐⭐
⭐⭐
People.ai
⭐⭐⭐
⭐⭐⭐
⭐⭐⭐⭐
⭐⭐
Salesforce
⭐⭐⭐⭐
⭐⭐⭐⭐⭐
⭐⭐⭐
⭐
Salesloft
⭐⭐
⭐⭐
⭐
⭐
Oliv AI covers all four artifacts, though its own G2 reviewers ask for deeper dashboard customization, which is the honest current limit of an agent-first model.
"I'd love to see few more options to customize dashboards and reports for different teams." Verified User, 26 Jun 2026Oliv AI G2 Verified Review
💰 The pricing signal hiding inside the artifact question
Watch how vendors price the investigation layer. Per-seat licensing on an analyst capability financially punishes curiosity, because every extra person who wants to ask a question costs money.
A per-organisation model, priced flat for unlimited users and queries, inverts that. I read that as the clearest tell in the category about whether a vendor wants reporting used or just owned, and it is worth checking against any revenue intelligence software platform on your list.
Oliv AI's Analyst agent answers ad-hoc strategic questions in plain English, returning curated data with interpretive commentary, and reviewers report getting answers in one click instead of queuing with RevOps. One customer's reaction to a report that named three specific rep skill gaps was simply being speechless, which tells me the bar for "reporting" was set very low for a very long time.
Q6. What does revenue reporting software cost, and should you just build it yourself? [toc=6. Cost and Build vs Buy]
Three models compete. Per-seat runs roughly $19 to $500 per user monthly. Per-action credit models charge around $0.10 per agent action, which makes spend unpredictable at scale. Per-organisation pricing, such as $4,999 flat for unlimited users and queries, suits teams where many people ask questions. Build only if reporting is your product.
Oliv AI sits at the bottom of the per-seat range, starting at $19 per user per month, with agents added one at a time rather than as a bundle.
💸 The costs that never appear on the pricing page
Sticker price is maybe 60% of what you actually spend. Four line items get missed.
Implementation. Weeks of RevOps time, even on "easy" tools.
Data integration. Connecting CRM, billing, and warehouse is engineering work.
Consulting for multi-entity setups. Multi-currency configuration is rarely self-serve.
The curiosity tax. Per-seat licensing means fewer people query, so the tool gets used less.
Stack Gong, Clari, and a sequencer for a 25-to-200-rep team, and total cost of ownership clears $500 per user monthly. That is the quiet part of the standard playbook, and it is visible in published Gong pricing tiers once you add the modules.
🔨 The buyer who chose to build, and what broke
I lost a deal to an internal build. Reasonable logic: they already had every call recording, so why pay a vendor?
Three to four months in, they had insights. Real ones, extracted from calls. Then the actual question arrived: how do you relate a call insight to the state of the deal it belongs to? That join, from conversation to opportunity to forecast, was the whole product, and it was the part they had not built.
⚠️ The honest exception
Build when reporting is your product, when you have a data engineer with spare capacity, or when your revenue model is so unusual no vendor matches it.
I say that as someone who builds. Twelve apps shipped on Replit in 150 days, used a million times. Building is not the hard part. Maintaining a data join across four systems while your reps change how they sell is the hard part.
🗣️ What buyers say about cost
"It's more affordable compared to other options we previously used." Verified User, 23 Jun 2026Oliv AI G2 Verified Review
"I cannot download all the data myself unless we upgrade the plan, which isn't ideal and results in me not fully utilizing Gong." Verified User, 3 Oct 2025Gong G2 Verified Review
"Consolidating multiple tools into Oliv has saved us budget and increased our results." Verified User, 8 Jul 2026Oliv AI G2 Verified Review
That Gong quote is a cost problem disguised as a feature gate. Paying for data you cannot fully export is a real line item, and it is one reason consolidation across AI sales tools keeps beating best-of-breed stacking.
Oliv AI's pricing view is that SaaS is now a commodity and should be priced like one: start at $19 per user monthly, audit the workflow, deploy one agent, validate the ROI, then extend. We do it that way because nobody should buy a suite they cannot deploy.
Q7. How do you pressure-test a revenue reporting tool before you sign? [toc=7. Buyer Evaluation Tests]
Run five live tests in one 30-minute demo. Ask the vendor to trace a board number back to its source transaction. Request a custom report built on the call. Ask it to write one field back to your CRM. Ask for the attribution join key. Ask who verifies an AI-written summary before leadership reads it.
⚠️ Why demos fail buyers
In a standard demo, the vendor drives and you watch. You see a polished dataset that was configured for the demo, not for you.
Nothing in that hour tests the thing that will actually hurt you in month four. Take the mouse. Make them build live.
✅ The five tests, with pass criteria
Metric lineage. Pick one number on their dashboard. Ask them to trace it to the source transaction. Pass: they get there in under two minutes, on screen.
Custom report, live. Name a metric you actually use. Pass: it exists before the call ends, no follow-up email.
CRM writeback. Ask them to write one MEDDIC methodology field back to your CRM. Pass: the field updates in your sandbox during the call.
Integration depth. CRM, ERP, Stripe, and warehouse. Pass: named connectors, not "we can build that."
AI verification. Ask who signs off on a generated summary. Pass: a role and a workflow, not a disclaimer.
🔍 Review patterns that predict rollout pain
Read the one-and-two-star reviews before you read the case studies. Four failure signatures repeat.
"Extremely slow performance, especially when switching between segments. Exporting data loses all customisations and filters." Verified User, 24 Jun 2025Aviso G2 Verified Review
"Analytics/metrics are faulty like email opens... A handful of features don't work properly (inbound calls, task reminders, data connectivity between apps (CRM, Sales Nav)." Verified User, 26 Mar 2025Salesloft G2 Verified Review
Broken exports, faulty metrics, sync drops, and missing custom reports. Any one of these turns a signed contract into shelfware, which is why reading verified reviews beats reading case studies.
⏰ The training-time question nobody asks
Ask this directly: how many real meetings before the tool understands our sales methodology? Vague answers mean months of tuning.
Oliv AI needs three meetings to learn a team's methodology, and reviewers report full setup in five to fifteen minutes with an engineer on the call. I would still budget two to four weeks for full customization, because deep configuration is genuinely slower than onboarding, as any implementation timeline comparison shows.
🧪 The activity-capture bug worth reproducing
If you evaluate native CRM activity capture, test the exclusion rules with your real email traffic. Some systems flag an email as containing sensitive information when it plainly does not, a pattern documented in Salesforce Einstein reviews.
The email silently drops out of the record. You do not notice until a QBR, when the customer picture has holes nobody can explain.
🎯 Where this category is going
Here is the number that should shape your evaluation. 87% of enterprises missed 2025 revenue targets despite record AI investment. Spend was not the constraint.
Revenue orchestration is already old. What I think replaces it is revenue engineering: you stop coordinating humans around dashboards and start designing systems that produce the outcome. The distinction is simple. A vending machine gives fixed output for fixed input. An agent takes a goal and pursues it, which is the whole argument behind the move from RevOps to intelligence to orchestration.
Oliv AI runs agents across pipeline, sales, retention, and upsell for 100+ revenue teams, and reviewers describe CRM records updating automatically after every call. What I am still sitting with is whether managers will trust an agent's forecast before they trust their own spreadsheet, or only after a quarter of being right. If you have run that experiment on your own team, I would genuinely like to hear which way it went.
FAQ's
What is revenue reporting software, and how is it different from revenue recognition tools?
Revenue reporting software unifies CRM, billing, and warehouse data to produce four artifacts: dashboards, custom reports, attribution views, and executive summaries. Revenue recognition software is a different category entirely. It governs when revenue may be booked under ASC 606 and IFRS 15.
The clean split is this:
Reporting explains what happened and why. Owned by RevOps and sales leadership.
Recognition governs what you may book and when. Owned by finance and the controller.
Intelligence forecasts what comes next. Owned by sales leadership and RevOps.
Take a $1,200 annual contract signed in January. Reporting tells you it came from a partner referral and closed in 34 days. Recognition spreads it as $100 per month across twelve months. Intelligence flags in month nine that usage dropped and renewal is at risk. Same contract, three systems, three jobs.
Oliv AI operates in the reporting and action layer, plugging into Salesforce, HubSpot, and Zoho rather than replacing them, so recognition stays inside finance's system of record. That boundary matters more than vendors admit. If you are still mapping the wider landscape, our breakdown of revenue intelligence platforms shows where the forecasting layer sits relative to reporting.
Which revenue reporting software is best for a mid-market team in 2026?
It depends on which of the four reporting artifacts is actually broken for you. The shortlist maps cleanly to buyer profiles rather than to feature counts.
Managers hand-build the Monday forecast: Oliv AI, for agent-generated briefs plus CRM writeback.
Finance owns revenue modeling at enterprise scale: Anaplan, despite the licensing cost.
Salesforce-standardized, forecast speed over custom reports: Clari.
Conversation data is the strategic asset: Gong.
HubSpot shop under 100 reps: Forecastio.
Buying-group coverage is a reported metric: People.ai.
CRM hygiene is already strong and budget is zero: native Salesforce reports.
On our weighted rubric, Oliv AI scores 88 out of 100, Gong 74, Clari 62, Terret 60, and Anaplan 58. Oliv AI loses its 12 points on dashboard customization, a gap named by its own G2 reviewers, which is the predictable trade-off of an agent-first design.
Our advice for mid-market buyers is to start with what you already own. Run native CRM reports first, then buy only where the CRM genuinely cannot answer the question. Teams weighing incumbents often start with our list of Clari alternatives.
How much does revenue reporting software cost in 2026?
Three pricing models compete, and they behave very differently as you scale.
Per-seat: roughly $19 to $500 per user monthly. Predictable, and best for stable headcount with defined users.
Per-action credits: around $0.10 per agent action. Unpredictable, and realistically suited only to low-volume pilots.
Per-organisation: flat pricing, for example $4,999 for unlimited users and queries. Predictable, and the right fit when many people ask occasional questions.
Sticker price is maybe 60% of real spend. The four line items that get missed are implementation time from RevOps, data integration engineering across CRM, billing, and warehouse, consulting for multi-entity and multi-currency setups, and the curiosity tax, where per-seat licensing means fewer people query and the tool gets used less.
Stack Gong, Clari, and a sequencer for a 25-to-200-rep team and total cost of ownership clears $500 per user monthly. Oliv AI sits at the bottom of the per-seat range, starting at $19 per user per month, with agents added one at a time rather than bought as a suite. For the enterprise comparison point, see our Gong pricing breakdown.
Why do revenue dashboards keep failing sales managers on Monday morning?
Dashboards fail because they shift the analysis onto the manager. A dashboard renders the data and then hands the reasoning back to a human, which is the most expensive labor in the org.
The cost is measurable. Picture a manager with eight reps. Thursday and Friday go to one-on-ones, one to two hours each, reconstructing what moved and why. That is 8 to 16 hours a week spent assembling a number rather than improving it. Meanwhile 55% of sales leaders lack high confidence in their forecast, and only 41% of sales managers and executives are satisfied with their current dashboards for decision-making.
The standard fix makes it worse. Everyone treats bad reporting as a visualization problem, so they add another tool, and each added tool makes the stack more brittle. Board numbers break at the join between systems, not at the chart.
Oliv AI was built against this exact workflow: its forecast agent assembles the weekly and monthly roll-ups, so the Thursday scrub becomes a review instead of a reconstruction. One reviewer reports forecast accuracy up 27% after switching. Compare that approach against dashboard-led forecasting in our analysis of Gong forecasting.
Can revenue reporting software actually do attribution from lead source to recognized revenue?
Rarely, and this is the least honest part of most vendor pitches. Attribution is the rarest of the four reporting artifacts because most tools stop at pipeline source and never reach recognized revenue.
The technical reason is a missing join key. You need a single identifier that survives the full trip:
From lead source, through the opportunity record.
Into the billing or subscription record.
Out to recognized revenue in the ledger.
Without that key, marketing reports pipeline, finance reports revenue, and the two numbers never reconcile. That is why attribution disputes are rarely resolved by buying another dashboard.
Ask any vendor to name the join key on the demo call. If the answer is a workflow description rather than a field, attribution is a roadmap item.
Among the tools we assessed, People.ai leads on contact-to-opportunity mapping, which is genuinely useful for buying-group coverage. Oliv AI's Context Graph associates activity to the correct CRM object before agents act on it, which is the upstream half of the same problem. For the broader orchestration view, see our guide to revenue orchestration platforms.
Should we build our own revenue reporting instead of buying a tool?
Build only if reporting is your product. Everything else usually looks cheaper than it turns out to be.
We lost a deal to an internal build with reasonable logic behind it. The team already had every call recording, so why pay a vendor? Three to four months in, they had real insights extracted from calls. Then the actual question arrived: how do you relate a call insight to the state of the deal it belongs to? That join, from conversation to opportunity to forecast, was the whole product, and it was the part they had not built.
The honest exceptions are narrow:
Reporting is genuinely your product or a differentiator you sell.
You have a data engineer with spare capacity, not a borrowed one.
Your revenue model is unusual enough that no vendor matches it.
Building is not the hard part. Maintaining a data join across four systems while your reps change how they sell is the hard part. Oliv AI's position is that agents should make your existing CRM accurate rather than create a parallel reporting system. Buyers weighing consolidation instead of construction can start with our roundup of AI sales tools.
How do we pressure-test a revenue reporting vendor before signing?
Take the mouse and make them build live. In a standard demo the vendor drives and you watch a dataset configured for the demo, not for you, and nothing in that hour tests what will hurt you in month four.
Run these five tests in one 30-minute call:
Metric lineage. Pick one dashboard number and ask them to trace it to the source transaction. Pass: under two minutes, on screen.
Custom report, live. Name a metric you actually use. Pass: it exists before the call ends.
CRM writeback. Ask them to write one methodology field into your sandbox. Pass: the field updates during the call.
Integration depth. CRM, ERP, Stripe, and warehouse. Pass: named connectors, not "we can build that."
AI verification. Ask who signs off on a generated summary. Pass: a role and a workflow, not a disclaimer.
Then read the one-and-two-star reviews before the case studies. Broken exports, faulty metrics, sync drops, and missing custom reports are the four signatures that turn a signed contract into shelfware. Also ask how many real meetings the tool needs to learn your methodology. Oliv AI needs three, with reviewers reporting setup in five to fifteen minutes, though we would still budget two to four weeks for deep customization, as our implementation timeline comparison explains.
Enjoyed the read? Join our founder for a quick 7-minute chat — no pitch, just a real conversation on how we’re rethinking RevOps with AI.
Revenue teams love Oliv
Here’s why:
All your deal data unified (from 30+ tools and tabs).
Insights are delivered to you directly, no digging.
AI agents automate tasks for you.
Thank you! Your submission has been received!
Oops! Something went wrong while submitting the form.
Meet Oliv’s AI Agents
Hi! I’m, Deal Driver
I track deals, flag risks, send weekly pipeline updates and give sales managers full visibility into deal progress
Hi! I’m, CRM Manager
I maintain CRM hygiene by updating core, custom and qualification fields, all without your team lifting a finger
Hi! I’m, Forecaster
I build accurate forecasts based on real deal movement and tell you which deals to pull in to hit your number
Hi! I’m, Coach
I believe performance fuels revenue. I spot skill gaps, score calls and build coaching plans to help every rep level up
Hi! I’m, Prospector
I dig into target accounts to surface the right contacts, tailor and time outreach so you always strike when it counts
Hi! I’m, Pipeline tracker
I call reps to get deal updates, and deliver a real-time, CRM-synced roll-up view of deal progress
Hi! I’m, Analyst
I answer complex pipeline questions, uncover deal patterns, and build reports that guide strategic decisions
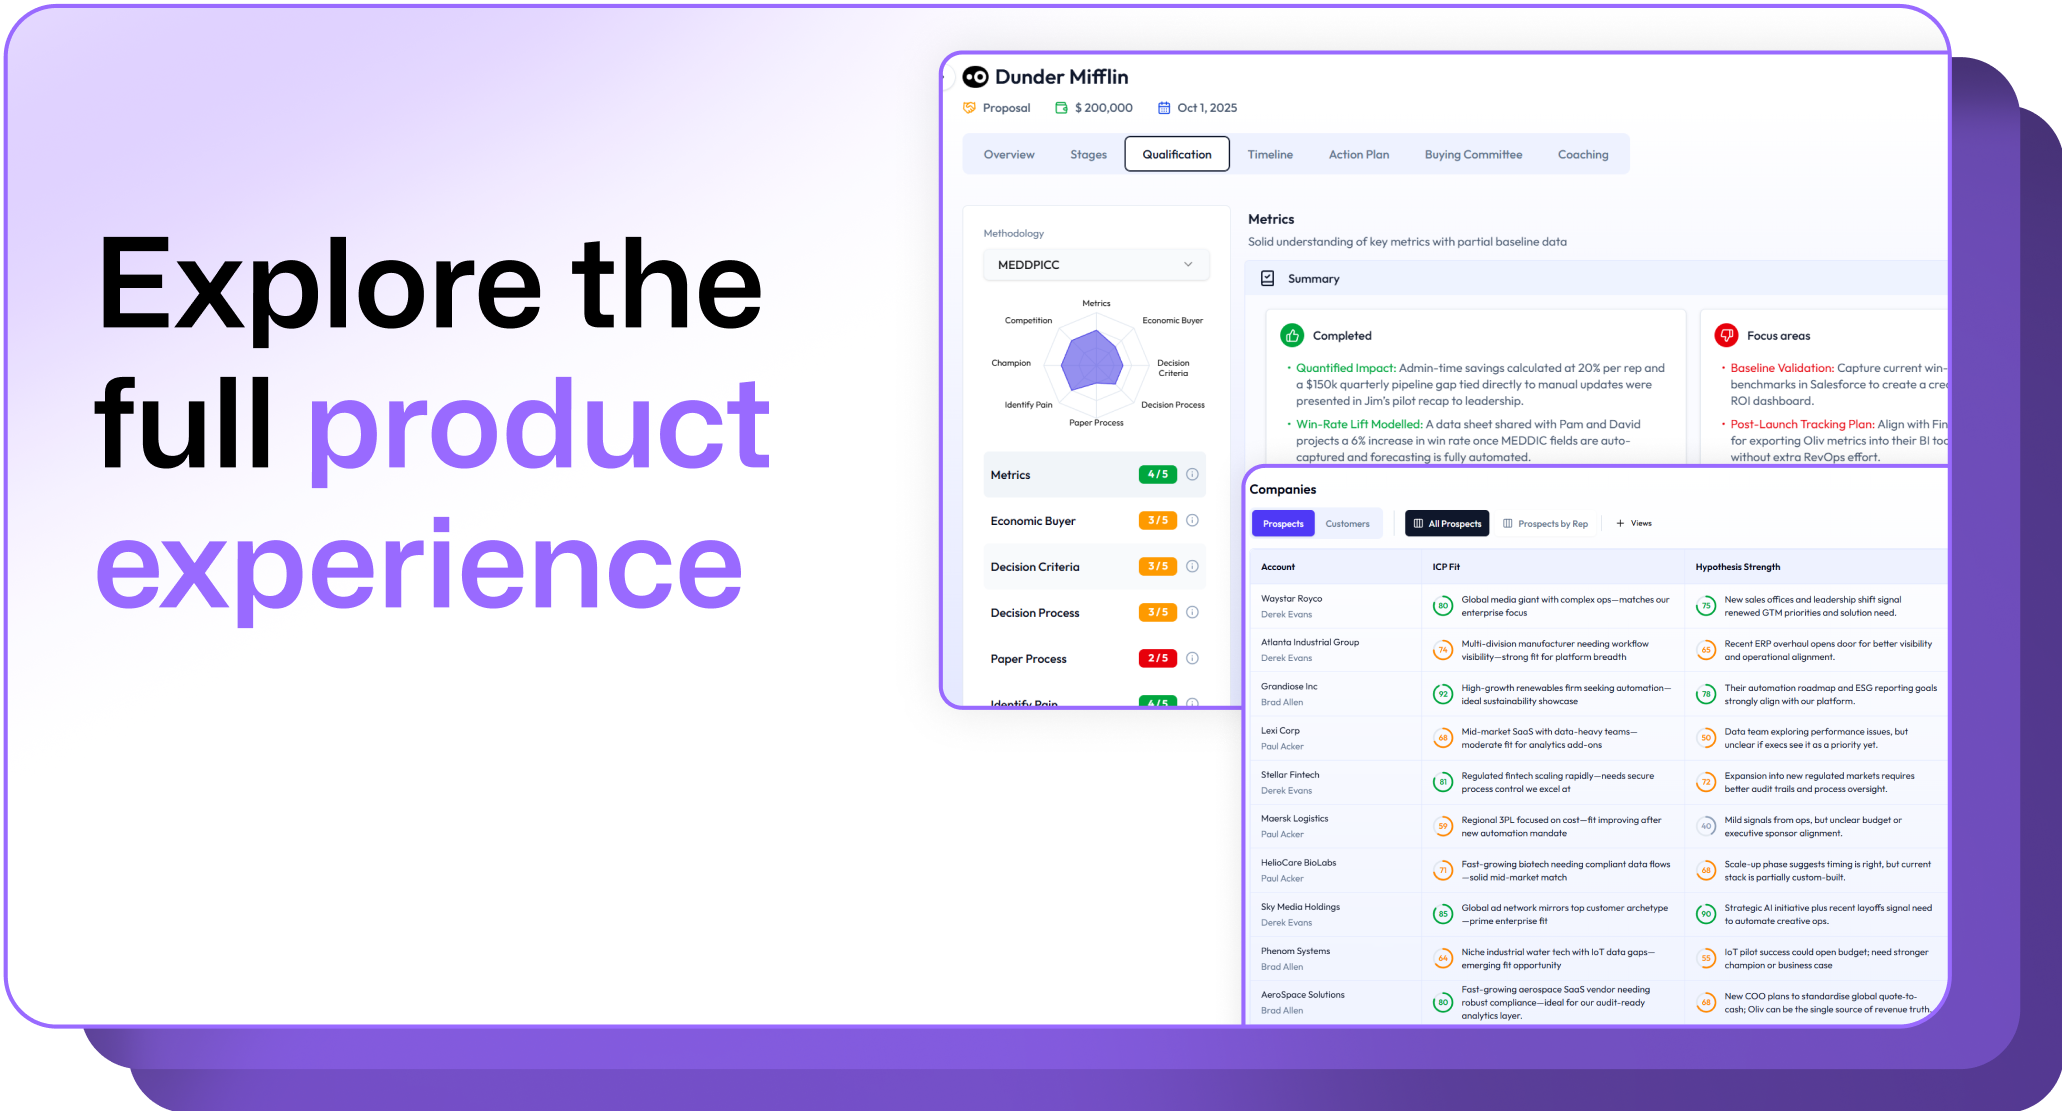
.avif)
.png)