All your deal data unified (from 30+ tools and tabs).
Insights are delivered to you directly, no digging.
AI agents automate tasks for you.
Thank you! Your submission has been received!
Oops! Something went wrong while submitting the form.
Meet Oliv’s AI Agents
Hi! I’m, Deal Driver
I track deals, flag risks, send weekly pipeline updates and give sales managers full visibility into deal progress
Hi! I’m, CRM Manager
I maintain CRM hygiene by updating core, custom and qualification fields all without your team lifting a finger
Hi! I’m, Forecaster
I build accurate forecasts based on real deal movement and tell you which deals to pull in to hit your number
Hi! I’m, Coach
I believe performance fuels revenue. I spot skill gaps, score calls and build coaching plans to help every rep level up
Hi! I’m, Prospector
I dig into target accounts to surface the right contacts, tailor and time outreach so you always strike when it counts
Hi! I’m, Pipeline tracker
I call reps to get deal updates, and deliver a real-time, CRM-synced roll-up view of deal progress
Hi! I’m, Analyst
I answer complex pipeline questions, uncover deal patterns, and build reports that guide strategic decisions
TL;DR
We all have those days where we seem busy but somehow don't get much done. It's like something's secretly stealing our time every day. How do we beat this feeling on such days?
Here's the thing: tracking productivity is not about working more hours; it's about making those hours count. And guess what? With a few simple metrics, you can turn your day from boring to super productive and still have time to enjoy that well-deserved cup of coffee.
In this upbeat guide, we will talk about some important productivity metrics to track. These are clear, simple, and super relatable ways to measure how well you're doing. Let's get started!
Key sales productivity metrics for businesses to track
Productivity metrics are not just numbers and graphs; they can significantly improve your business's performance. Let's understand a few key metrics that can transform the way you look at your business's productivity.
1. Sales revenue
This is your scoreboard. It's the total income your business earns from sales activities. Watching this number go up is a sign you're gaining ground in the market. It's straightforward – higher sales revenue equals business growth and increased market share.
2. Customer acquisition cost (CAC)
CAC shows how much you've spent to get each new customer through the door. It's a reality check for your sales and marketing efforts, ensuring you're not spending more to acquire a customer than they're worth.
3. Customer lifetime value (CLTV)
CLTV predicts the future value of your relationships. It estimates the total revenue a business can expect from a single customer throughout their relationship. This metric is a cornerstone for long-term planning, helping you decide how much to invest in keeping your customers happy.
4. Conversion rate
This metric is all about effectiveness. It measures the percentage of leads that turn into customers. A high conversion rate means your sales process and marketing efforts are hitting the mark. If it's low, it might be time to reevaluate your approach.
5. Customer retention rate
It's easier and cheaper to keep an existing customer than to find a new one. This metric measures how well you're doing at this, showing the percentage of customers who stick around. High retention rates often signal customer satisfaction and product or service quality.
6. Net promoter score (NPS)
NPS gauges customer loyalty and satisfaction by asking one simple question: How likely are you to recommend us to a friend? The answers can help predict business growth and show you how well you're meeting customer needs.
7. Sales cycle length
This metric tells you how long it takes to turn a lead into a customer. Short sales cycles are generally better, indicating your sales process is efficient. If it's taking too long, it might be time to streamline your approach.
8. Sales pipeline coverage
This is about ensuring you have enough potential deals in your pipeline to meet future sales targets. It compares the current sales pipeline to the quota, helping you forecast whether you're on track to meet your goals.
Sales productivity metrics for sales professionals
In a world where distractions are a tap away, it's easy to confuse activity with productivity. Tracking the right productivity metrics can transform that endless busywork into real, satisfying progress.
1. Leads generated
This metric shows the number of new potential customers each sales rep is bringing in. It's a direct reflection of their effort and initiative in expanding the business's reach. More leads mean more opportunities to sell.
2. Average deal size
This measures the average revenue each sale brings in. It highlights the value each sales rep adds to the business with their deals. Larger average deals mean your team is maximizing the value of each customer interaction.
3. Quota attainment
This straightforward metric shows which sales reps are meeting or exceeding their targets. It's a clear indicator of performance, rewarding those who are contributing most to the company's sales goals.
4. Win/loss rate
By comparing the number of deals won to those lost, this ratio provides insights into a sales rep's effectiveness. It helps identify strengths and areas for improvement, ensuring your team becomes more successful over time.
5. Sales activity metrics
This category includes the nuts and bolts of sales efforts: calls made, emails sent, meetings scheduled, and proposals delivered. It's a window into the daily activities of your sales team, showing who's really putting in the work to close deals.
6. Productivity per sales rep
Finally, this measures the output (revenue or deals closed) per salesperson. It highlights the efficiency and effectiveness of each team member, showing who's really driving results for your business.
So, why not start tracking these metrics today? With the right approach and tools, you'll not only feel more productive but actually be more productive. Remember, it's not about being busy—it's about being effective.
Leveraging Technology to Track Productivity Metrics
1. Time management and tracking
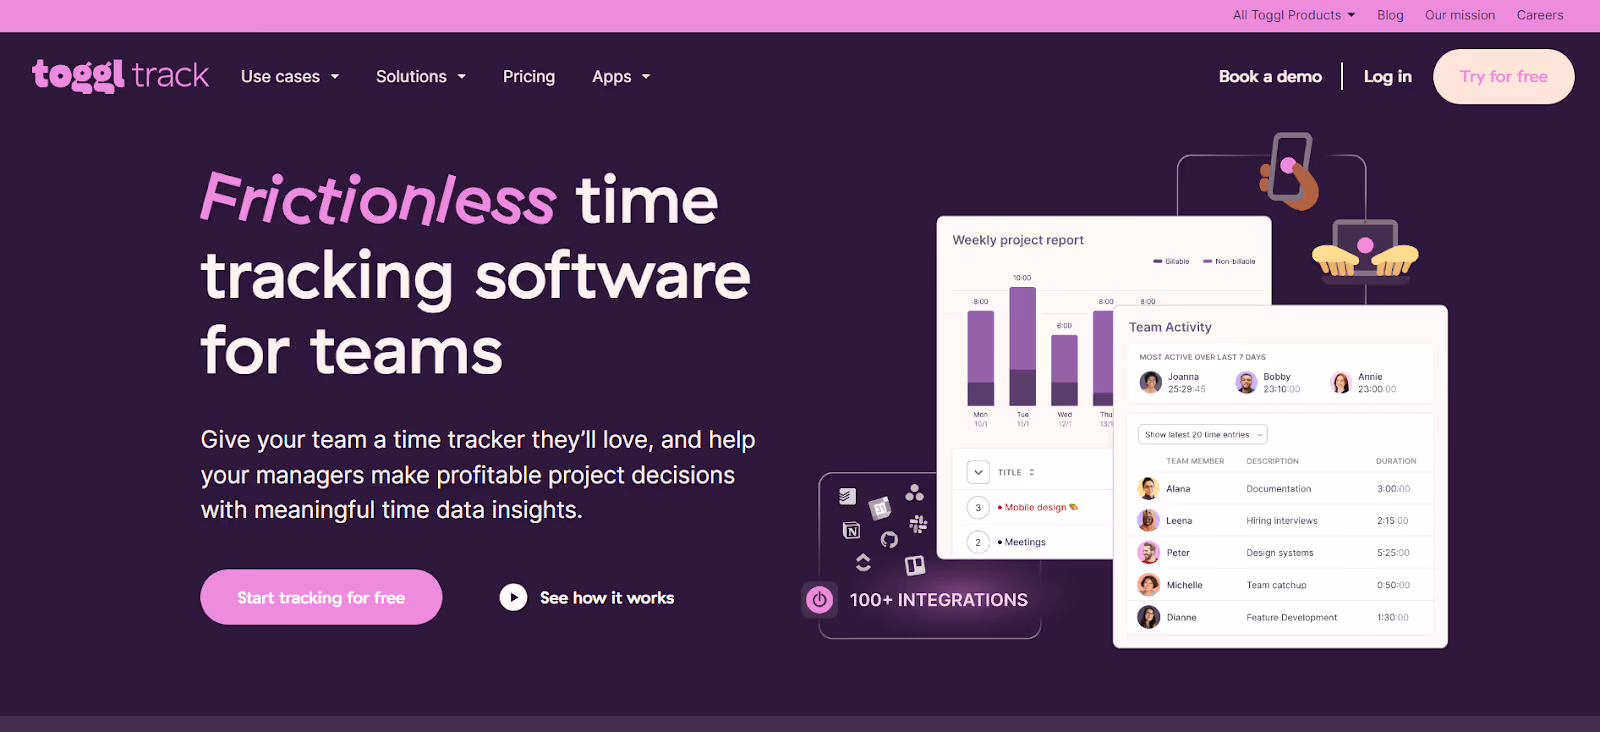
a) Toggl Track
Offers simple time tracking with powerful reporting. It's great for freelancers and teams wanting to see where their time goes.
b) RescueTime
Runs in the background of your device, tracking time spent on apps and websites, giving you an accurate picture of your day.
c) Clockify
A free time tracker and timesheet app for teams of any size. It allows you to track hours, generate reports, and bill clients.
2. Project management and organization
a) Asana
A project management tool that helps teams organize, track, and manage their work tasks and projects in one shared space.
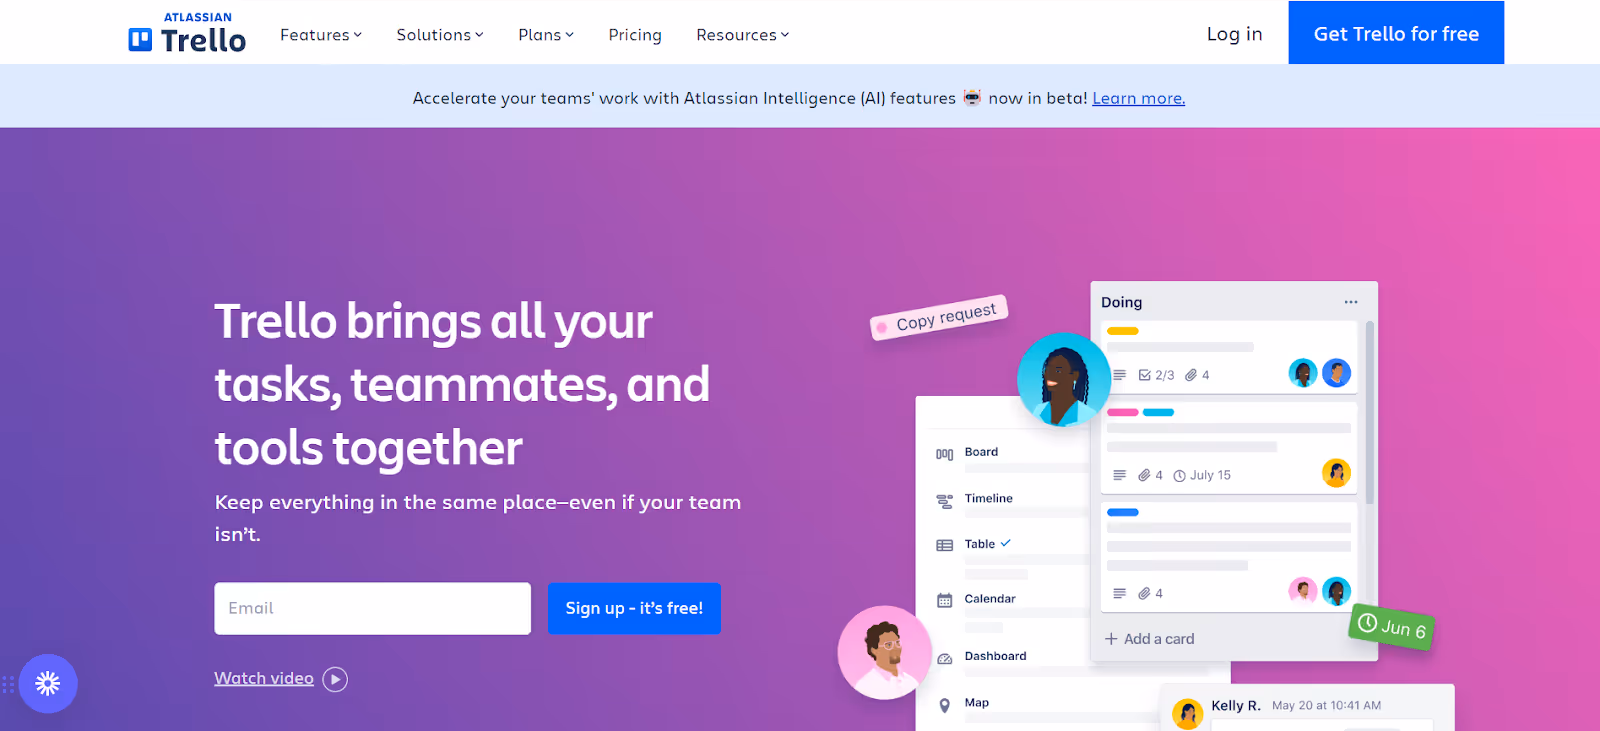
b) Trello
Uses boards, lists, and cards to help organize and prioritize projects in a fun, flexible, and rewarding way.
c) Monday.com
A Work OS that powers teams to run projects and workflows with confidence. It's a simple but intuitive tool that enables people to manage work, meet deadlines, and build a culture of transparency.
3. Sales efficiency and task management
a) Obsidian
A knowledge management tool that turns your notes into a connected web of information, enabling you to think, write, and organize your thoughts more effectively, ensuring your ideas interlink seamlessly.
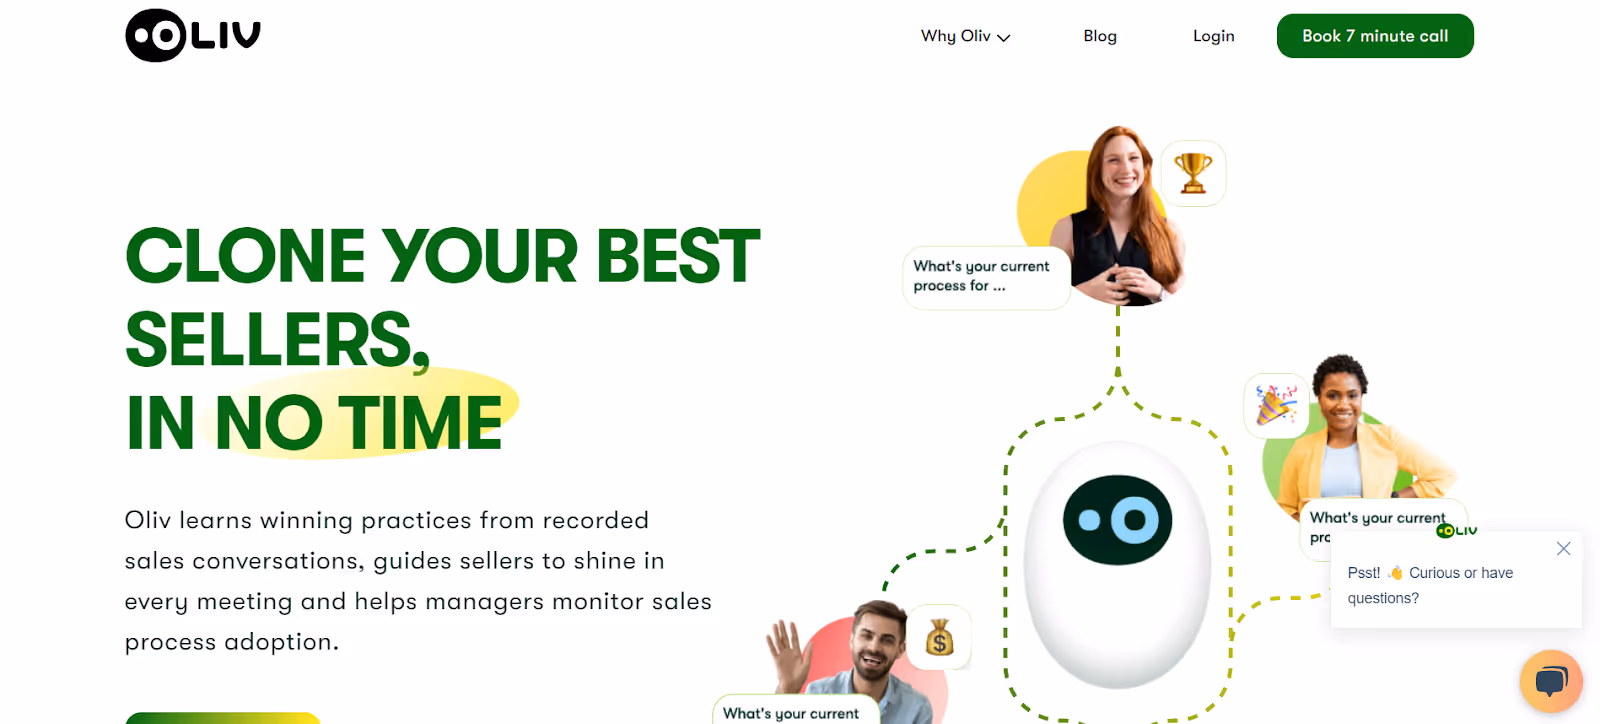
b) Oliv AI
An overall sales automation software that reduces time spent on client research, follow-up process and much more.
c) Notion
An all-in-one workspace where you can write, plan, collaborate, and get organized - it allows you to take notes, add tasks, manage projects & more.
4. Habit and focus enhancers
a) Forest
An app designed to help you stay focused on the important things in life. Whenever you want to focus, plant a tree. Your tree will grow while you focus on your work, leaving you with a lovely forest if you stay on track.
b) Focus@Will
A productivity platform that uses music scientifically optimized to help you focus and reduce distractions.
Final thoughts
So, there we have it- From understanding the importance of tracking our productivity to diving into the specifics of which metrics to keep an eye on, we've covered a lot of ground.
The more we understand about our habits, our time, and the work we do, the better equipped we are to make meaningful changes. And isn't that the goal? To not just move through our days on autopilot but to steer our ship with purpose and direction.
The tools and software we've discussed—Toggl Track, RescueTime, Asana, and all their digital brethren—they help us cut through the noise, focus on what matters, and ultimately, find more time for the things we love.
But remember, at the heart of all this technology and all these metrics is you. Your goals, your progress, and your well-being. So, as we close this guide, let's not forget to be more present, more engaged, and more satisfied with our work and our lives. Stay productive!
We all have those days where we seem busy but somehow don't get much done. It's like something's secretly stealing our time every day. How do we beat this feeling on such days?
Here's the thing: tracking productivity is not about working more hours; it's about making those hours count. And guess what? With a few simple metrics, you can turn your day from boring to super productive and still have time to enjoy that well-deserved cup of coffee.
In this upbeat guide, we will talk about some important productivity metrics to track. These are clear, simple, and super relatable ways to measure how well you're doing. Let's get started!
Key sales productivity metrics for businesses to track
Productivity metrics are not just numbers and graphs; they can significantly improve your business's performance. Let's understand a few key metrics that can transform the way you look at your business's productivity.
1. Sales revenue
This is your scoreboard. It's the total income your business earns from sales activities. Watching this number go up is a sign you're gaining ground in the market. It's straightforward – higher sales revenue equals business growth and increased market share.
2. Customer acquisition cost (CAC)
CAC shows how much you've spent to get each new customer through the door. It's a reality check for your sales and marketing efforts, ensuring you're not spending more to acquire a customer than they're worth.
3. Customer lifetime value (CLTV)
CLTV predicts the future value of your relationships. It estimates the total revenue a business can expect from a single customer throughout their relationship. This metric is a cornerstone for long-term planning, helping you decide how much to invest in keeping your customers happy.
4. Conversion rate
This metric is all about effectiveness. It measures the percentage of leads that turn into customers. A high conversion rate means your sales process and marketing efforts are hitting the mark. If it's low, it might be time to reevaluate your approach.
5. Customer retention rate
It's easier and cheaper to keep an existing customer than to find a new one. This metric measures how well you're doing at this, showing the percentage of customers who stick around. High retention rates often signal customer satisfaction and product or service quality.
6. Net promoter score (NPS)
NPS gauges customer loyalty and satisfaction by asking one simple question: How likely are you to recommend us to a friend? The answers can help predict business growth and show you how well you're meeting customer needs.
7. Sales cycle length
This metric tells you how long it takes to turn a lead into a customer. Short sales cycles are generally better, indicating your sales process is efficient. If it's taking too long, it might be time to streamline your approach.
8. Sales pipeline coverage
This is about ensuring you have enough potential deals in your pipeline to meet future sales targets. It compares the current sales pipeline to the quota, helping you forecast whether you're on track to meet your goals.
Sales productivity metrics for sales professionals
In a world where distractions are a tap away, it's easy to confuse activity with productivity. Tracking the right productivity metrics can transform that endless busywork into real, satisfying progress.
1. Leads generated
This metric shows the number of new potential customers each sales rep is bringing in. It's a direct reflection of their effort and initiative in expanding the business's reach. More leads mean more opportunities to sell.
2. Average deal size
This measures the average revenue each sale brings in. It highlights the value each sales rep adds to the business with their deals. Larger average deals mean your team is maximizing the value of each customer interaction.
3. Quota attainment
This straightforward metric shows which sales reps are meeting or exceeding their targets. It's a clear indicator of performance, rewarding those who are contributing most to the company's sales goals.
4. Win/loss rate
By comparing the number of deals won to those lost, this ratio provides insights into a sales rep's effectiveness. It helps identify strengths and areas for improvement, ensuring your team becomes more successful over time.
5. Sales activity metrics
This category includes the nuts and bolts of sales efforts: calls made, emails sent, meetings scheduled, and proposals delivered. It's a window into the daily activities of your sales team, showing who's really putting in the work to close deals.
6. Productivity per sales rep
Finally, this measures the output (revenue or deals closed) per salesperson. It highlights the efficiency and effectiveness of each team member, showing who's really driving results for your business.
So, why not start tracking these metrics today? With the right approach and tools, you'll not only feel more productive but actually be more productive. Remember, it's not about being busy—it's about being effective.
Leveraging Technology to Track Productivity Metrics
1. Time management and tracking
a) Toggl Track
Offers simple time tracking with powerful reporting. It's great for freelancers and teams wanting to see where their time goes.
b) RescueTime
Runs in the background of your device, tracking time spent on apps and websites, giving you an accurate picture of your day.
c) Clockify
A free time tracker and timesheet app for teams of any size. It allows you to track hours, generate reports, and bill clients.
2. Project management and organization
a) Asana
A project management tool that helps teams organize, track, and manage their work tasks and projects in one shared space.
b) Trello
Uses boards, lists, and cards to help organize and prioritize projects in a fun, flexible, and rewarding way.
c) Monday.com
A Work OS that powers teams to run projects and workflows with confidence. It's a simple but intuitive tool that enables people to manage work, meet deadlines, and build a culture of transparency.
3. Sales efficiency and task management
a) Obsidian
A knowledge management tool that turns your notes into a connected web of information, enabling you to think, write, and organize your thoughts more effectively, ensuring your ideas interlink seamlessly.
b) Oliv AI
An overall sales automation software that reduces time spent on client research, follow-up process and much more.
c) Notion
An all-in-one workspace where you can write, plan, collaborate, and get organized - it allows you to take notes, add tasks, manage projects & more.
4. Habit and focus enhancers
a) Forest
An app designed to help you stay focused on the important things in life. Whenever you want to focus, plant a tree. Your tree will grow while you focus on your work, leaving you with a lovely forest if you stay on track.
b) Focus@Will
A productivity platform that uses music scientifically optimized to help you focus and reduce distractions.
Final thoughts
So, there we have it- From understanding the importance of tracking our productivity to diving into the specifics of which metrics to keep an eye on, we've covered a lot of ground.
The more we understand about our habits, our time, and the work we do, the better equipped we are to make meaningful changes. And isn't that the goal? To not just move through our days on autopilot but to steer our ship with purpose and direction.
The tools and software we've discussed—Toggl Track, RescueTime, Asana, and all their digital brethren—they help us cut through the noise, focus on what matters, and ultimately, find more time for the things we love.
But remember, at the heart of all this technology and all these metrics is you. Your goals, your progress, and your well-being. So, as we close this guide, let's not forget to be more present, more engaged, and more satisfied with our work and our lives. Stay productive!
FAQ's
What are the most important sales productivity metrics to track?
We recommend tracking metrics at two distinct levels: organizational and individual. At the business level, focus on sales revenue (total income from sales activities), customer acquisition cost (CAC showing spend per new customer), customer lifetime value (CLTV predicting relationship value), conversion rate (percentage of leads becoming customers), customer retention rate (percentage of customers who stay), net promoter score (NPS measuring loyalty), sales cycle length (time from lead to customer), and sales pipeline coverage (ensuring enough deals to meet targets).
At the sales professional level, essential metrics include leads generated (new potential customers per rep), average deal size (revenue per sale), quota attainment (meeting or exceeding targets), win/loss rate (deals won versus lost), sales activity metrics (calls, emails, meetings, proposals), and productivity per sales rep (output per person).
The key is tracking metrics that provide actionable insights rather than just generating numbers. We recommend exploring our AI-native Revenue Orchestration platform to automatically capture and analyze these metrics without manual data entry across your entire sales organization.
How do I measure customer acquisition cost (CAC) accurately?
Customer acquisition cost shows how much you spend to get each new customer through the door, serving as a reality check for your sales and marketing efforts. The fundamental principle is ensuring you're not spending more to acquire a customer than they're worth.
To calculate CAC accurately, sum all sales and marketing expenses over a specific period (including salaries, advertising spend, software costs, agency fees, and overhead) and divide by the number of new customers acquired during that same timeframe. For example, if you spent $50,000 on sales and marketing in a quarter and acquired 50 customers, your CAC is $1,000.
The metric becomes truly valuable when compared against customer lifetime value (CLTV). A healthy ratio is typically 3:1, meaning each customer generates three times more value than they cost to acquire. If your CAC exceeds or approaches CLTV, you need to reevaluate your acquisition strategy immediately.
We track CAC automatically by connecting to your CRM and financial systems, providing real-time visibility into acquisition efficiency. Start a free trial to see how our platform surfaces CAC trends and alerts you to efficiency changes across channels and campaigns.
What's the difference between conversion rate and win/loss rate?
While both metrics measure sales effectiveness, they track different stages of your sales funnel and serve distinct purposes.
Conversion rate measures the percentage of leads that turn into customers across your entire funnel. It's a broad effectiveness metric showing whether your overall sales process and marketing efforts are hitting the mark. If conversion rate is low, it signals fundamental issues with lead quality, messaging, or sales approach requiring immediate attention. You calculate it as: (Number of customers acquired ÷ Total leads) × 100.
Win/loss rate is a more granular metric specific to individual sales reps or opportunities that entered active sales stages. It compares the number of deals won to those lost, providing insights into a sales rep's closing effectiveness once an opportunity is qualified. This ratio helps identify individual strengths and areas for improvement, ensuring your team becomes more successful over time. Calculate it as: Deals won ÷ (Deals won + Deals lost).
Essentially, conversion rate looks at the entire funnel from lead to customer, while win/loss rate focuses specifically on qualified opportunities in active sales stages. Our platform automatically tracks both metrics with drill-down capabilities by rep, product, region, and deal stage.
Why is quota attainment the most important metric for individual sales reps?
Quota attainment is the most straightforward metric showing which sales reps are meeting or exceeding their targets, serving as a clear indicator of individual performance. It directly rewards those who contribute most to the company's sales goals, making it the definitive measurement of rep effectiveness.
Unlike activity metrics (calls made, emails sent) that measure effort, quota attainment measures results. A rep can have high activity scores but low quota attainment, revealing that their efforts aren't translating into closed business. Conversely, high quota attainment with lower activity suggests exceptional efficiency and deal quality.
The metric also enables fair performance comparisons across reps with different territories, product lines, or market segments when quotas are properly calibrated. It provides objective data for compensation decisions, promotion considerations, and coaching prioritization.
However, we recommend analyzing quota attainment alongside complementary metrics like average deal size, win/loss rate, and sales activity metrics to understand the complete performance picture. For example, a rep with 120% quota attainment but declining average deal size might be cherry-picking easy wins rather than pursuing strategic accounts.
Our Forecaster agent automatically tracks quota attainment in real-time with predictive analytics showing which reps will likely miss targets, allowing proactive coaching interventions.
How do sales activity metrics connect to actual productivity?
Sales activity metrics—including calls made, emails sent, meetings scheduled, and proposals delivered—provide a window into the daily efforts of your sales team, showing who's putting in the work to close deals. However, these metrics represent inputs, not outputs.
The connection to actual productivity depends on correlation with results. High activity should translate to more leads generated, better quota attainment, and higher productivity per sales rep (revenue or deals closed per person). When activity metrics rise but productivity metrics stagnate or decline, you've identified a critical efficiency problem.
We recommend establishing activity baselines for successful reps, then using those benchmarks to identify underperformers. For example, if top performers average 50 outbound calls daily with a 15% connection rate and 30% meeting-set rate, reps with similar activity but lower connection rates need coaching on messaging and timing.
The real value emerges when you analyze activity patterns across the sales cycle. Winning deals typically show consistent touchpoint patterns—initial discovery calls, follow-up emails, demo meetings, proposal presentations, and negotiation discussions in predictable sequences. Deviations from these patterns indicate where deals go off track.
Our AI Data Platform automatically captures all sales activities from calls, emails, and meetings without manual logging, correlates them with deal outcomes, and identifies which activity patterns predict wins versus losses.
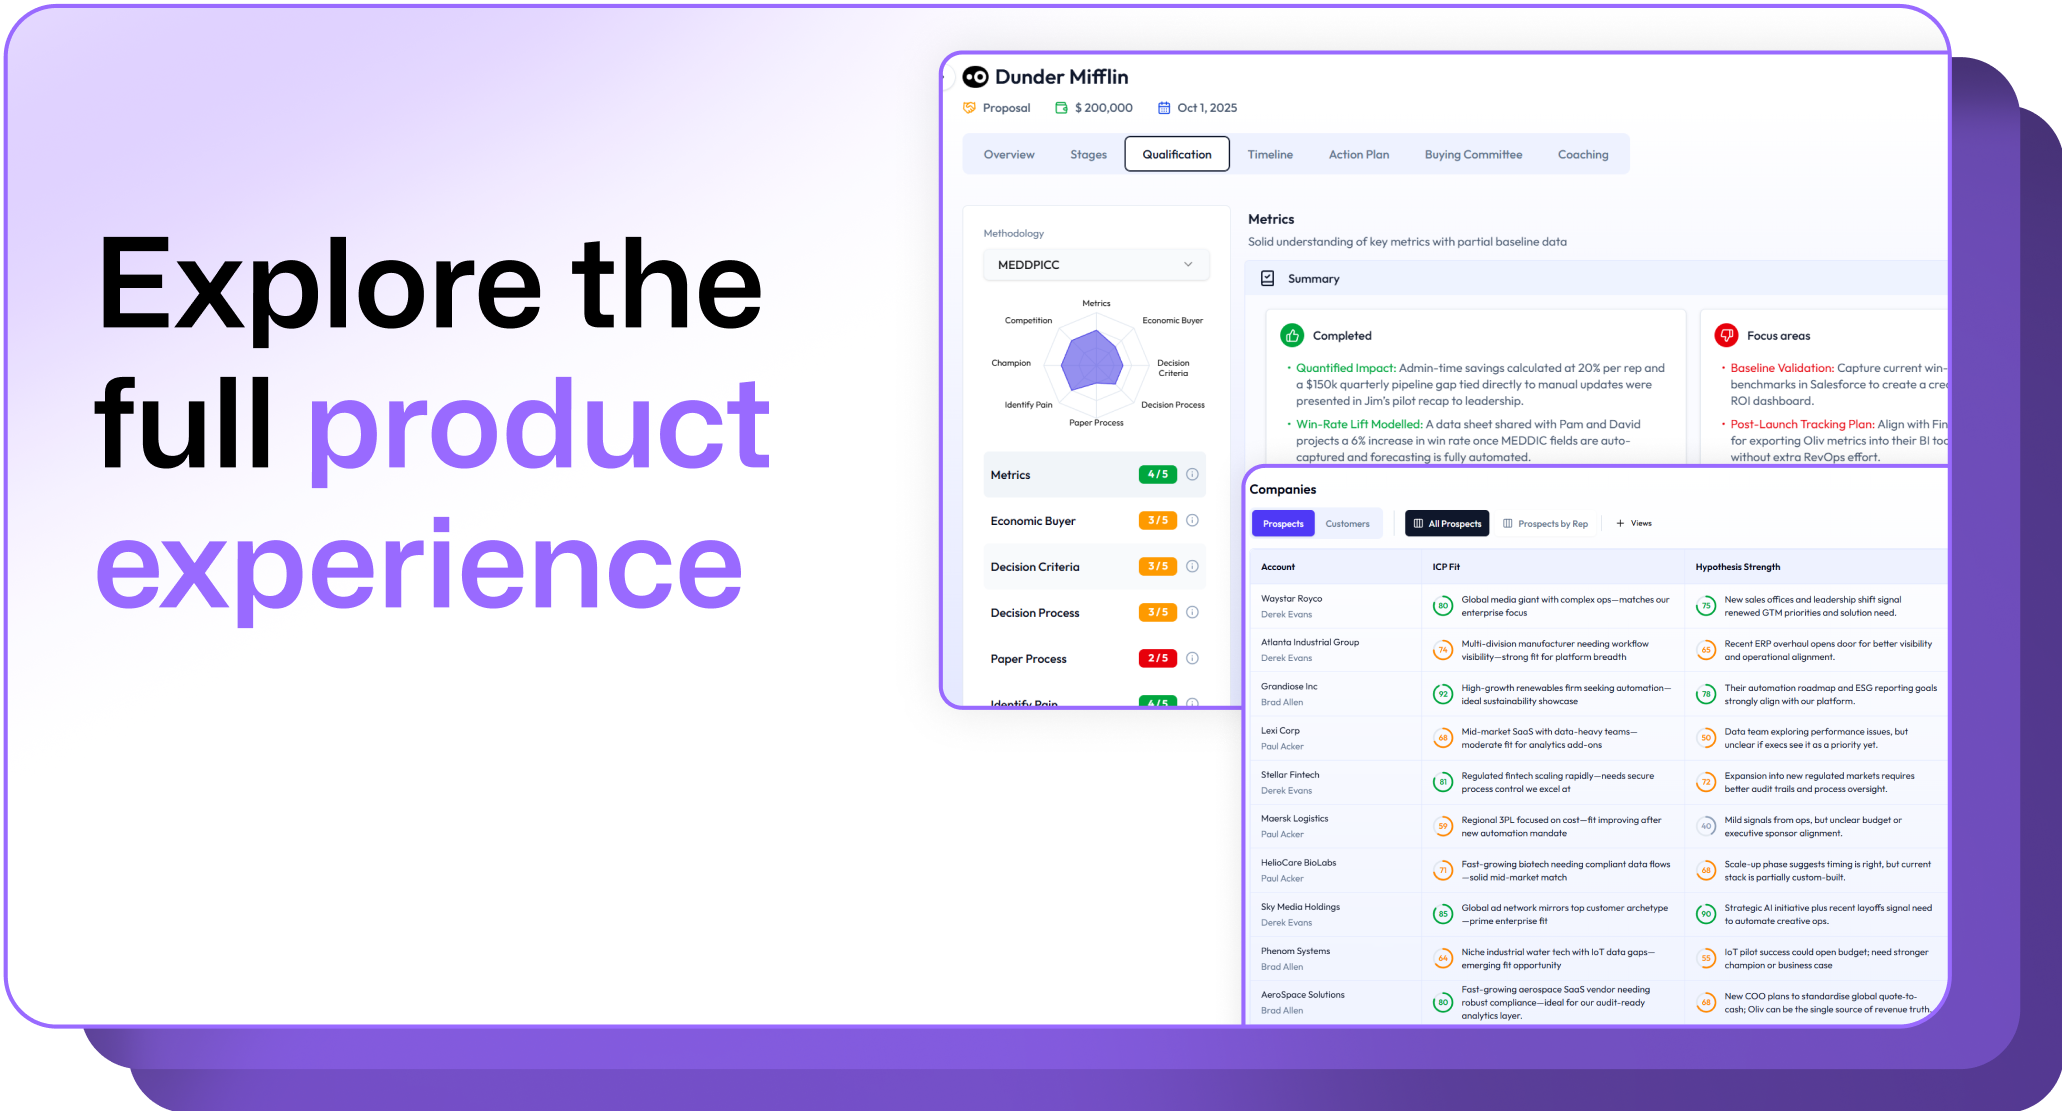
How does Oliv AI automate sales productivity metrics tracking better than traditional tools?
Traditional sales tools like Gong, Clari, and Salesforce Einstein require significant manual data entry, impose standardized workflows that rarely fit your specific process, and bury users in disconnected data rather than delivering actionable insights. We've built our platform to solve these exact failures through AI-native Revenue Orchestration.
Our architecture operates on two interconnected layers:
AI Data Platform automatically tracks and manages all sales data from calls, emails, and meetings without any manual entry. Unlike competitors that require reps to log activities and update CRM fields, we capture everything automatically—sales revenue per rep, leads generated, meeting outcomes, email engagement, and deal progression.
Customizable AI Agents execute specific workflows tailored to your organization's unique processes. Our agents don't just track metrics; they analyze patterns and deliver insights proactively.
CRM Manager ($29/month) updates quota attainment, pipeline coverage, and deal progression in real-time by auto-filling CRM fields
Forecaster (alpha) calculates win/loss rates, sales cycle length, and conversion rates automatically by inspecting every deal in your pipeline
Analyst Agent allows natural language queries like "Show me average deal size by rep this quarter" without building custom reports
Unlike Gong's 3-6 month implementation requiring third-party vendors, we deploy in days with just three meetings to understand your methodology. Start your free trial to see automated productivity tracking with zero manual data entry.
What's the cost difference between using Oliv AI versus stacking Gong and Clari for productivity tracking?
Companies frequently stack Gong for conversational intelligence and Clari for forecasting because neither tool alone provides comprehensive productivity visibility. This approach creates massive cost inefficiencies, data silos, and workflow fragmentation.
Here's the financial reality:
Traditional Stack Costs:
Gong: $160-$250 per user per month, plus $5,000+ base platform fee, plus $10,000-$30,000 implementation fees
Clari: ~$100-$200 per user per month with add-ons (Copilot, Groove), plus platform and implementation fees
Combined total: Approximately $500 per user per month for a 50-person team = $25,000 monthly or $300,000 annually
For a 100-person sales organization, you're looking at $600,000 annually just for these two tools, not including integration costs, training time, or the RevOps resources needed to manually extract insights from their "wonky APIs".
Oliv AI Unified Approach:
Starter: $19/user/month for baseline conversational intelligence
Standard: $49/user/month with meeting insights
Supreme: $89/user/month with combined insights, deal scorecards, and forecasting
No platform fees, implementation fees, or training costs
For that same 100-person team using our Supreme tier: $8,900 monthly or $106,800 annually. That's an 82% cost reduction while delivering superior functionality through our generative AI-native foundation.
We also offer special discounts for teams migrating from Gong. Book a call with our founder to discuss your specific migration timeline and cost savings.
Enjoyed the read? Join our founder for a quick 7-minute chat — no pitch, just a real conversation on how we’re rethinking RevOps with AI.
Revenue teams love Oliv
Here’s why:
All your deal data unified (from 30+ tools and tabs).
Insights are delivered to you directly, no digging.
AI agents automate tasks for you.
Thank you! Your submission has been received!
Oops! Something went wrong while submitting the form.
Meet Oliv’s AI Agents
Hi! I’m, Deal Driver
I track deals, flag risks, send weekly pipeline updates and give sales managers full visibility into deal progress
Hi! I’m, CRM Manager
I maintain CRM hygiene by updating core, custom and qualification fields, all without your team lifting a finger
Hi! I’m, Forecaster
I build accurate forecasts based on real deal movement and tell you which deals to pull in to hit your number
Hi! I’m, Coach
I believe performance fuels revenue. I spot skill gaps, score calls and build coaching plans to help every rep level up
Hi! I’m, Prospector
I dig into target accounts to surface the right contacts, tailor and time outreach so you always strike when it counts
Hi! I’m, Pipeline tracker
I call reps to get deal updates, and deliver a real-time, CRM-synced roll-up view of deal progress
Hi! I’m, Analyst
I answer complex pipeline questions, uncover deal patterns, and build reports that guide strategic decisions